20110605

Excel as a Business Intelligence Platform - Part 1

This is a Part 1 of surprise Guest post. My guest is Ugur Kadakal, Ph.D., he is the CEO and founder of Pagos, Inc., which he started almost 10 years ago.

Dr. Kadakal is an expert in Excel, Business Intelligence, Data Analytics and Data Visualization. His comprehensive knowledge of Excel, along with his ambitious inventions and ideas, supply the foundation for all Pagos products, which include SpreadsheetWEB (which converts Excel spreadsheets into web applications), SpreasheetLIVE  (a fully-featured, browser-based spreadsheet application environment) and Pagos Spreadsheet Component (which integrates Excel spreadsheets into enterprise web applications).

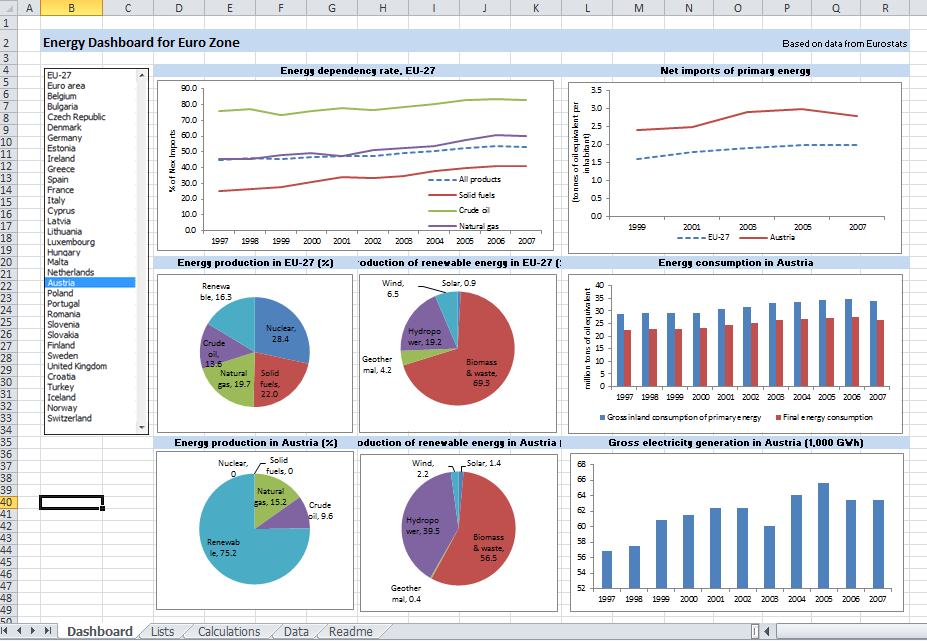
Pagos started and hosted the largest free collection and repository of professional templates of Excel spreadsheets on the web: http://spreadsheetzone.com . 3 Excel-based Dashboard below can be found on this very popular repository and done by Dr. Kadakal:

Dashboard 1 : Human Resources Dashboard: http://spreadsheetzone.com/templateview.aspx?i=498

Dashboard 2 : Business Activity Dashboard in EuroZone: http://spreadsheetzone.com/templateview.aspx?i=490

Dashboard 3 : Energy Dashboard for Euro Zone: http://spreadsheetzone.com/templateview.aspx?i=491

The topic is large, so this Guest article is splitted on 3 blog posts. The first portion of article contains the Introduction and Part 1 "Use of Excel as a BI Platform Today", then I expect Dr. Kadakal will do at least 2 more posts: Part 2 - "Dos and Don’ts of building dashboards in Excel", Part 3 - "Moving Excel dashboards to the Web".

Excel as a Business Intelligence Platform – Part 1


Introduction


Electronic spreadsheets were one of the very first Business Intelligence (BI) software. While the availability of spreadsheet software and it use as a tool for data analysis dates back to the 1960s, its application in the BI field began with the integration of OLAP and pivot tables. In 1991, Lotus released Improve, followed by Microsoft’s release of PivotTable in 1993. However, Essbase was the first scalable OLAP software to handle large data sets that the early spreadsheet software was incapable of. This is where its name comes from: Extended Spread Sheet Database.

There is no doubt that Microsoft Excel is the most commonly used software for BI purposes. While Excel is general business software, its flexibility and ease of use makes it popular for data analysis with millions of users worldwide. Excel has an install base of hundreds of millions of desktops: far more than any other BI platform. It has become a household name. From educational utilization to domestic applications and enterprise implementation, Excel has been proven incredibly indispensable. Most people with commercial or corporate backgrounds have developed a proficient Excel skillset. This makes Excel the ultimate self-service BI platform. However, like all systems, Excel has some weaknesses that make it difficult to use as a BI tool under certain conditions.


Use of Excel as a BI Platform Today


Small Businesses


Traditionally, small businesses are not considered as an important market segment by most BI vendors. Their data analysis and reporting needs are limited primarily due to their smaller commercial volumes. However, this is changing quickly as smaller organizations begin to collect large amounts of data, thanks to the Internet and social media, and require tools to manage that data. However, what is not changing is the limited financial resources available to them. Small businesses cannot spare to spend large amounts of money on BI software or consultants to aid them in the creation of the applications. That’s why Excel is the ideal platform for them and will most probably remain that way for a foreseeable future. The reasons are clear: (1) most of them already have Excel licenses, (2) most of their users know how to use Excel and (3) their needs are simpler and can be met with Excel.

Mid-Range Businesses


Mid-range businesses are a quickly growing market segment for BI vendors. Traditionally, Excel as a BI platform has been more popular among these businesses. Cost and availability are the primary factors in this. However, two aspects have been steering them to searching for alternatives: (1) Excel can no longer handle their growing data volumes and (2) other BI vendors started offering cost-effective alternatives.

As a result, Excel’s market share in this field is in decline although it still remains the most popular. On the other hand, with the release of Office 2010 and its extended capabilities for handling very large data sets, Excel stands a good chance at reversing this decline.


Large Enterprises


The situation with large enterprises is rather complex. Most of them already have large-scale a BI implementation in place. Those implementations often connect various databases and data warehouses within the organizations. They have made significant investments and continue doing so to expand and maintain their BI systems. They already have a number of dashboards and reports designed to serve their business units. However, business users always need new and different dashboards and reporting tools. The only software that gives them the ultimate flexibility in creating their own reports is Excel. As a result, even in large Enterprises, usage of Excel for BI purposes is common. Business users often go to their data warehouses or BI tools and get a data extract to bring into Excel. They can then prepare their analysis and build their reports in Excel.

Enterprises will continue using their existing platforms because they have made huge investments building those systems. However, Excel use by business users as their secondary BI and reporting tool will continue to rise unless the alternative vendors significantly improve their self-servicing capabilities.

Summary


Excel is one of the ultimate business platforms and offers unparalleled features and capabilities to non-programmers. This makes it an ideal self-service BI platform. In this article, we examined the use of Excel as a BI platform in companies of different sizes. In the next article of this series, we will discuss how to use Excel more efficiently as a BI platform, from handling data to calculations and visual interactions.

20110526

Footprint Comparison for DV Leaders

Comparison of DV Tools is the most popular page (and post) of this site, visited by many thousands of people. Some of them keep asking to append this comparison with different additional features, one of them is a comparison of requirements of leading DV tools for file and memory footprint and also for reading and saving time.

I took mid-sized dataset (428999 rows and 135 columns), exported it into CSV and compressed it to ZIP format, because all native DV formats (QVW by Qlikview, DXP by Spotfire, TWBX by Tableau and XLSX by Excel and PowerPivot) are compressed one way or another. My starting filesize (of ZIPped dataset) was 56 MB. Here is what I got, see for yourself:

[googleapps domain="spreadsheets" dir="spreadsheet/pub" query="hl=en_US&hl=en_US&key=0AuP4OpeAlZ3PdGszUVZDVGwxOE0wVExZcmhPdVlXQ2c&single=true&gid=0&output=html&widget=true" width="500" height="300" /]

One comment is that numbers above are all relative to configuration of hardware used for tests and also depend on other software I ran during tests, because that software also requires RAM, CPU cycles, disk I/O and even on speed of repainting applications windows on screen, especially for Excel. I probably will add more comments to this post/page, but my first impression from this comparison is that new Tableau's Data Engine (released in version 6.0 and soon will be updated in 6.1) made Tableau more competitive. Please keep in mind, that comparison of in-memory footprint was much less significant in above test, because Qlikview, Excel and PowerPivot putting all dataset into RAM, while Tableau and Spotfire can leave some (unneeded for visualization) data on disk, treating it as "virtual memory". Also Tableau using 2 executables (not just one EXE as others): tableau.exe (or tabreader.exe) and tdserver64.exe

Since Tableau is the only DV Leading software, capable to read from SSAS Cubes and from PowerPivot (local SSAS) Cubes, I also took large SSAS Cube and for testing purposes I selected SSAS Sub-Cube with 3 Dimensions, 2 Measures and 156439 "rows", measured the Time and Footprint, needed for Tableau to read Sub-Cube, Refresh it in Memory, Save to local application file, and also measurted "Cubical" Footprint of it in Memory and on Disk and then compared all results with the same tests while running Excel 2010 alone and Excel 2010 with PowerPivot:

[googleapps domain="spreadsheets" dir="spreadsheet/pub" query="key=0AuP4OpeAlZ3PdFZUczdEbEVqU2lOMXRDOXJBUXJnQ3c&single=true&gid=1&output=html&widget=true" width="500" height="300" /]

While Tableau's ability to read and visualize Cubes is cool, performance-wise Tableau is far behind of Excel and PowerPivot, especially in Reading department and memory footprint. In Saving department and File footprint Tableau is doing nothing because it is not saving cube locally in its local application TWBX file (and it keeps data in SSAS cube outside of Tableau) so Tableau's file footprint for SSAS Cubes is not an indicator but for PowerPivot-based local Cubes Tableau does better job (saving data into local application file) then both Excel and PowerPivot!

20110505

Spotfire 3.3: mature, scalable, social

TIBCO released Spotfire 3.3 and first (see what is new here) that jumped to my eyes was how mature this product is. For example, among new features is improved scalability - each additional simultaneous user of a web analysis initially claims very little additional system memory:


Many Spotfire customers will be able to support a greater number of web users on their existing hardware by upgrading to 3.3. Spotfire Web Player 3.3 includes significant improvements in memory consumption (as shown above for certain scenarios). Theoretically goal is to minimize the amount of system memory needed to support larger numbers of simultaneous users on the same analysis file. Main use case here: the larger the file and the greater the number of simultaneous web users on that file, then less initial system memory required to support each additional user: it is greatly reduced compared to version 3.2.1 and earlier.

Comparison with competition and thorough testing of new Spotfire scalability has to be done (similar to what Qliktech done with Qlikview here), but my initial reaction is as I said in a Title: we are witnessing a very mature software. Apparently the Defense Intelligence Agency (DIA) agrees with me and Defense Intelligence Agency Selects TIBCO Spotfire Analytics Solutions for Department of Defense Intelligence Information System Community. "With more than 16,500 military and civilian employees worldwide, DIA is a major producer and manager of foreign military intelligence"

Spotfire 3.3 also includes collaborative bookmarking, which enables all Spotfire users  to capture a dashboard - its complete configuration, including markings, drop down selections, and filter settings and share that visualization immediately with other users of that same dashboard, regardless of client in use. Spotfire actually not just a piece of Data Visualization Software, but a real Analytical Platform with large portfolio of products, including completely integrated S-PLUS (commercial version of R Library which has million of users), best Web Client (you can go Zero-footprint with Spotfire Web Player or/and partially free Spotfire Silver), free iPad Client version 1.1.1 (requires iTunes, so be prepared for Apple intrusion), very rich API, SDK, integration with Visual Studio, support of IronPython and JavaScript , well-thought Web Architecture, set of Extension Points etc.

System requirements for Spotfire 3.3 can be found here. Coincidentally with 3.3 Release Spotfire VAR Program got expansion too. Spotfire has a very rich set of training options, see it here. You can also find set of good Spotfire videos from Colin White's Screencast Library, especially 2011 Webcasts.

My only and large concern with Spotfire is its focus, since it is part of a large corporation TIBCO, which has 50+ products and 50+ reasons to focus on something else. Indirectly it can be confirmed with sales: my estimate that Tableau is growing much faster than Spotfire (sales-wise) and Qlikview Sales probably 3 times larger (dollar-wise) than Spotfire sales. Since TIBCO bought Spotfire in 2007, I expected Spotfire will be integrated with other great TIBCO products, but after 4 years it is still not a case... And TIBCO has no reason to change its corporate policies, since its busines is good and stock is doing well:


(at least 500% increase of share price since end of 2008!). Also see article written by Ted Stamas for SeekingAlpha and comparison of TIBX vs. ETF here:


I think it is interesting to notice that TIBCO recently rejected a buyout offer from HP!

20110430

Good week for Qliktech

Last week of April 2011 was good for Qliktech. It released the results for a First Quarter 2011 and they are very positive.

Revenue is up (does not look like it is slowing down) 44% YoY, if compared with 1Q2010 with revenue $63M and projection for total 2011 now about $300M (up from preliminary projection of $280M before Q1 happened). Ended the first quarter of 2011 with an active customer count of approximately 19,000 (means about 900000 licensed, paying Data Visualization and BI users now and number of Qlikview users may exceed 1 million in 2011!), up from approximately 14,000 active customers at the end of the first quarter of 2010! Among other news:

  • Qliktech hired 103 new employees in Q1 of 2011 and currently employed 883 people (a 43% increase year-over-year).

  • Qliktech signed a strategic alliance with Deloitte, starting with Netherlands and planning expansion of alliance to Deloitte worldwide.

  •  About 2 weeks ago Qliktech unveils one of the first HTML5-based full client application: Qlikview on iPad (free [user will need license to access Qlikview Server anyway] - and delivered it through the Safari mobile Web browser) - Qliktech claims that it is "every bit as rich as a native app."


I guess most of DV Client applications should have HTML5 reincarnation soon... As a result of all these positive sound bites, Qliktech shares ended this week above $32, more than tripled in 9 months:


and I compared Qliktech's relative growth in above Annotated Timeline chart with Microstrategy, TIBCO and Apple (yes, Qliktech is growing at least twice faster than ... Apple). I cannot include Tableau in comparison, because Tableau Software is still ... a private company.

Qliktech's capitalization as of today, 4/30/11 is $2.5B, $1B more than Microstrategy and only twice less than TIBCO's capitalization. I know at least 3 software vendors, who are focused only on BI and DV: Tableau (it is still a private company; BTW, Tableau 6.1 will be released soon) - growing faster (114% YoY- see it here) than anybody, Qliktech (share price has tripled in last 9 months) and Microstrategy (it's share price almost doubled in last 9 months). I consider the dedication to DV and BI as very important for future success in DV market; for example TIBCO's Spotfire is only one of 50+ TIBCO's products... and it dangers the future of one of the most advanced and mature DV products - Spotfire (version 3.3 is coming soon) .

One of reasons for Qliktech growth is its 1000+ partners and extensive Partner Programs for OEM Partners, Solution Providers, Business Consultants and System Integrators. Those overdeveloped Partner Programs required mandatory commitments from Partners in terms of Revenue Targets, Membership Fees, Qlikview Certifications and Minimum number of Trained employees. Lately Qliktech unreasonably raised those requirements and it may backfire and slowdown Qliktech growth and will help competitors like Tableau (Tableau actually opposite to Qliktech: their partnership program is underdeveloped - in my opinion - and requires big improvements) and recently Microstrategy (which seems learning from own and competitors mistakes and catching up lately).

Update 3 months later:


in Q2 of 2011 Qliktech reached 21000 customers worldwide (it means almost 1 million licensed users), $74 Millions in revenue (45% over Q2 2o1o); 1000 full time employes (400+ more compare with Q2 2010), $2.4B Market Capitalization and guess what - $2.2  Million of lost!

Permalink: http://apandre.wordpress.com/2011/04/30/good-week-for-qliktech/

20110423

Visual Insight from Microstrategy

Microstrategy is a famous and BI-dedicated company, operating for 22+ years, recently released Visual Insight (as part of the release of Microstrategy 9.2 this week) and joint the DV race. A couple of years ago, I advised to some local company in terms of choosing Data Visualization Partner and final 3 choices were Qlikview, Spotfire and Microstrategy. Microstrategy was most competitive pricing-wise, but their Data Visualization functionality was not ready yet. They are ready now, see it here (from webcast this week):


Visual Insight as part of Microstrategy 9.2 targets so called "self-service BI", and transition (they acknowledged that) from "old BI" (tabular reports: published static and OLAP reports) to "new BI" (Data Visualization and Dashboards), from Desktop to Mobile Clients (that is a forward looking statement for sure), from Physical to Cloud.

Microstrategy is claiming that Visual Insight allows to visualize Data in 30 minutes (that is good to know, but DV Leaders already have it for a while, welcome to the club!) compare with 30 days for the same process with "traditional BI":


(I am saying this for 6 years now and on this blog since inception of it; does it mean that old BI is useless now and too pricey? Microstrategy presenters saying that answer is yes! and I want to thank Microstrategy for the validation of my 6-years old conclusion). For full set of Microstrategy 9.2 slides click here.

Microstrategy 9.2 has a full BI product portfolio, fast in-memory Data Engine, free mobile and tablet clients, has even Free Reporting Suite . Microstrategy (like Qliktech, Tableau and Visokio) is completely focused on Business Intelligence and Data Visualization functionality unlike its giant competitors like SAP, IBM, Oracle and Microsoft.

Update 9/27/11. MIcrostrategy released free Cloud Personal edition, based on Visual Insight, see it for yourself here:


20110410

Visual BI with Vizubi

Since many people will use Excel regardless of how good other BI and DV tools are, I am regularly comparing abilities of Excel to solve Data Visualization problems I discussed on this site. In most cases Excel 2003 is completely inappropriate and obsolete (especially visually), Excel 2007 is good only for limited DV tasks like Infographics, Data Slides, Data Presentations, Static Dashboards and Single-Chart Visualizations. Excel 2010 has some features relevant to Data Visualizations, including one of the best columnar in-memory databases (PowerPivot as free add-in), an ability to synchronize multiple Charts through slicers, a limited ability to drilldown data using slicers and even the support for both 64-bit and 32-bit. However, when comparing with Qlikview, Spotfire and Tableau the Excel 2010 feels like a stone-age tool or at least 2 generation behind as far as Data Visualization (and BI) is a concern...

That was my impression until I started to use the Excel Plugin, called Visubi (from company with the same name, see it here ). Suddenly my Excel 2003 and Excel 2007 (I keep them for historical purposes) started to be almost as capable as Excel 2010, because Visubi adding to all those versions of Excel a very capable columnar in-memory database, slicers and many features you cannot find in Excel 2010 and PowerPivot and in addition is greatly improving the functionality of Excel PivotTables and Tables! Vizubi enables me to read (in addition to usual data sources like ODBC, CSV, XLS, XLSX etc.) even my QVD files (Qlikview Data files)! Visubi, unlike PowerPivot, will create Time Dimension(s) the same way as SSAS does. All above means that users are not forced to migrate to Office 2010, but they will have many PowerPivot features with their old version of Excel. In addition Vizubi added to my Excel tables and Pivots uniques feature: I can easily switch back and forth between Table and PivotTable presentation of my data.

Most important Visubi's feature is that all Vizubi's tables and pivots are interactive and each piece of data is clickable and enables me to drill down/up/through my entire dataset:

[youtube=http://www.youtube.com/v/HNpkGv1htt8&border=0]

It is basically equivalent or exceeded the drilldown ability of Qlikview, with one exception: Qlikview allows to do it through charts, but Vizubi does it through Tables and PivotTables. Visubi enables Excel user creates large databases with millions of rows (e.g. test database has 15 millions of rows) and enables ordinary users (non-developers) easily create Tables, Reports, Charts, Graphs and Dashboards with such database - all within familiar Excel environment using easy Drag-and-Drop UI:


Vizubi's Database(s) enables users to share data over central datastore, while keeping Excel as a personal desktop DV (or BI) client. See Vizubi videos here and tutorials here.

Vizubi is a small (15 employees) profitable Italian company and it is a living prove that size does not matter - Vizubi did something extremely valuable and cool for Excel users that giant Microsoft failed to do for many years, even with PowerPivot. Prices for Vizubi is minimal considering the value it adds to Excel: between $99 and &279, depends on the version and the number of seats (discounts are available, see it here ).

Vizubi is not perfect (they just at version 1.21, less then one year old product), for example I wish they will support a graphical drilldown like Qlikview does (outlining rectangles right on Charts and then instant selection of appropriate subset of data ), a web client (like Spotfire) and web publishing for their functionality (even Excel 2010 supports Slicers on a web in Office Live environment), 64-bit Excel (32-bits is so 20th century), the ability to read and use SSAS and PowerPivot directly (like Tableau does), some scripting (Javascript or VBScript like Qlikview) and"formula"  language (like PowerPivot with DAX) etc.

I suggest to review these articles about Vizubi: in TDWI by Stephen Swoyer and relatively old article  from Marco Russo at SQLBlog .

Permalink: http://apandre.wordpress.com/2011/04/10/visubi/

20110328

Deloitte: me DV too (it wishes...)

Last week Deloitte suddenly declared that 2011 will be a year of Data Visualization (DV for short, at least on this site) and main technology trend in 2011 will be a Data Visualization as "Emerging Enabler". It took Deloitte many years to see the trend (I advise to them to re-read posts by observers and analysts like Stephen Few, David Raab, Boris Evelson, Curt Monash, Mark Smith, Fern Halper and other known experts). Yes, I am welcoming Deloitte  to DV Party anyway: better late then never. You can download their "full" report here, in which they allocated first(!) 6 pages to Data Visualization. I cannot resist to notice that "DV Specialists" at Deloitte just recycling (using own words!) some stuff (even from this blog) known for ages and from multiple places on Web and I am glad that Deloitte knows how to use the Internet and how to read.

However, some details in Deloitte's report amazed me of how they are out of touch with reality and made me wondering in what Cave or Cage (or Ivory Tower?)

[gallery order="DESC" columns="2" orderby="ID"]

these guys are wasting their well-paid time? On a sidebar of their "Visualization" Pages/Post they published a poll: "What type of visualization platform is most effective in supporting your organization’s business decision making?". Among most laughable options to choose/vote you can find "Lotus" (hello, people, are you there? 20th century ended many years ago!), Access (what are you smoking people?), Excel (it cannot even have interactive charts and proper drilldown functionality, but yes, everybody has it), Crystal Reports (static reports are among main reasons why people looking for interactive Data Visualization alternatives), "Many Eyes" (I love enthusiasts, but it will not help me to produce actionable data views) and some "standalone options" like SAS and ILOG which are 2 generations behind of leading DV tools. What is more amazing that "BI and Reporting option" (Crystal, BO etc.) collected 30% of voters and other vote getters are "standalone option" (Deloitte thinks SAS and ILOG are  there) - 19% and "None of the Above" option got 22%!

In the second part of their 2011 Tech Trends report Deloitte declares the "Real Analytics" as a main trend among "Disruptive Deployments". Use of word "Real Analytics" made me laugh again and reminds me some other funny usage of the word "real": "Real Man", Real Woman" etc. I just want to see what it will be as an "unreal analytics" or "not real analytics" or whatever real antonym for "real analytics" is.

Update: Deloitte and Qliktech form alliance in last week of April of 2011, see it here.

More updates: In August 2011 Deloitte opened ""The Real Analytics website"" here: http://realanalyticsinsights.com/ and on 9/13/11 they "Joined forces in US with Qliktech: http://investor.qlikview.com/releasedetail.cfm?ReleaseID=604843

Permalink: http://apandre.wordpress.com/2011/03/29/deloitte-too/

20110324

Win $3M (if you have nothing better to do)

Heritage Provider Network is offering a cool $3 millions in prize money for the development of an algorithm that can best predict how often people are likely to be sent to the hospital. Jonathan Gluck -- senior executive at Heritage -- said the goal of the competition is to create a model that can "identify people who can benefit from additional services," such as nurse visits and preventive care. Such additional services could reduce health care spending and cut back on excessive hospitalizations, Gluck said.


The algorithm contest, the largest of its kind so far, is an attempt (also see Slate article here) to help find the best answers to complicated data-analysis questions. Previous known was the $1 million Netflix Inc. prize awarded in 2009 for a model to better predict what movies people would like. In 2009, a global team of seven members consisting of statisticians, machine-learning experts and computer engineers was awarded the $1 Million contest prize and Netflix replaced its legacy recommendation system with the team’s new algorithm (2nd Netflix's competition was stopped by FTC and lawyers). I personally think that this time Data Visualization will be a large part of winning solution.


The competition -- which will be run by Australian startup firm Kaggle -- begins on April 4 and will be open for about two years. Contestants will have access to de-identified insurance claims data to help them develop a system for predicting the number of days an individual is likely to spend in a hospital in one year. Kaggle spent months streamlining claims data and removing potentially identifying information, such as names, addresses, treatment dates and diagnostic codes. Teams will have access to three years of non-identifiable healthcare data for thousands of patients.

The data will include outpatient visits, hospitalizations, medication claims and outpatient laboratory visits, including some test results. The data for each de-identified patient will be organized into two sections: "Historical Data" and "Admission Data." Historical Data will represent three years of past claims data. This section of the dataset will be used to predict if that patient is going to be admitted during the Admission Data period. Admission Data represents previous claims data and will contain whether or not a hospital admission occurred for that patient; it will be a binary flag.


The training dataset includes several thousand anonymized patients and will be made available, securely and in full, to any registered team for the purpose of developing effective screening algorithms. The quiz/test dataset is a smaller set of anonymized patients. Teams will only receive the Historical Data section of these datasets and the two datasets will be mixed together so that teams will not be aware of which de-identified patients are in which set.

Teams will make predictions based on these data sets and submit their predictions to HPN through the official Heritage Health Prize web site. HPN will use the Quiz Dataset for the initial assessment of the Team's algorithms. HPN will evaluate and report back scores to the teams through the prize website's leader board.

Scores from the final Test Dataset will not be made available to teams until the accuracy thresholds are passed. The test dataset will be used in the final judging and results will be kept hidden. These scores are used to preserve the integrity of scoring and to help validate the predictive algorithms. You can find more about Online Testing and Judging here.


The American Hospital Association estimates that more than 71 million people are admitted to the hospital each year, and that $30 Billion is spent on unnecessary admissions.

20110313

Pagos Released SpreadsheetWEB 3.2

Pagos released this week SpreadsheetWEB 3.2 (PSW for short) with new Data Visualization features (Pagos Data Visualizer or PDV for short). Among those features is an ability to drill-down any Visible Data through synchronized filters, which immediately made the SpreadsheetWEB a player in Data Visualization Market.


Tools like Tableau, Qlikview or Spotfire allow people to visualize data, but have very limited ability to collect and update data. PSW (Pagos SpreadsheetWEB), on other hand, since versions 1.X was able to convert any Excel Spreadsheet into Web Application and Web-based Data Collector, to save collected data into SQL Server (including latest SQL Server 2008 R2) Database, and to Report or Visualize the Data online through SaaS web-based spreadsheet, which looks and behaves as Excel Spreadsheet! SpreadsheetWEB has unique ability to collect data in a Batch Process and run large datasets against SpreadsheetWEB application. This video demonstrates data collection and data management and collaborations utilizing workflow capabilities and SpreadsheetWEB Control Panel interface. SpreadsheetWEB can use Web-Service as Data Source (like Excel does) and allows web-based spreadsheets to function as Web Service too:


One of the reasons why most people still use and like Excel as a BI tool is that they can use many of the built-in worksheet formulas to process data in real-time while filtering the dashboard. SpreadsheetWEB converts those formulas and can execute them on the server. Database-driven SpreadsheetWEB applications support most features in Excel, including worksheet formulas, 333+ Excel functions, formatting, 33+ types of Excel charts as well as Sparklines,


also see video here:


as well as pivot tables, validation, comments, filters and hyperlinks, while almost completely eliminating the need for application and database developers, as well as need for IT services. Basically if person knows Excel, than he knows how to use SpreadsheetWEB. SpreadsheetWEB (both 64-bit and 32-bit) has HTML Editor and Scripting Support (JavaScript), similar to what macros do for Excel (be aware that it is not port of VBA):


Among 3 DV Leaders only Tableau is able to read Microsoft SQL Server Analysis Services (SSAS) data sources, which is a must for long-term success in Visual Analytics market. SpreadhseetWEB has this functionality the same way as Excel does and therefore ahead of Qlikview and Spotfire in this extremely important department. Among other advanced Data Visualization Features SpreadsheetWEB supports Maps in Dashboards


and multi-page Dashboard reports. I like Version Control for applications and Server Monitoring features - they can be very attractive for enterprise users. SpreadsheetWEB does not require SharePoint Server to execute Excel workbooks on the server. Pagos developed proprietary spreadsheet technology to achieve that independence from SharePoint Server (I personally consider SharePoint as a Virus). This makes Pagos very attractive to cost conscious small to medium size organizations. Installing SpreadsheetWEB only requires Windows Server and Microsoft SQL Server. In addition, SpreadsheetWEB works with free SQL Express Edition, which is an additional savings for Customers with small datasets.

For advanced Data Visualization functionality, Pagos established the OEM partnership with TIBCO and integrates SpreadsheetWEB with TIBCO Spotfire Analytic Platform. For advanced SaaS features, including strictest security and hosting requirements and SAS70 Compliance, Pagos partners with Rackspace.

SpreadsheetWEB is one of the few players in the market that offer Software-as-a-Service (SaaS) licensing along with traditional server licensing. Pagos has very attractive SaaS fees and extremely competitive pricing for those who want to buy own SpreadsheetWEB server: $4900 per SpreadsheetWEB server for 50 named users and 25 web applications and dashboards; that price at least 10 times better than prices from Qlikview, Spotfire and Tableau. Pagos provides 44+ Video Tutorials, 53+ online Demos, free non-expiring trial and Wiki-based full Documentation for SpreadsheetWEB, so people can review, browse and evaluate SpreadsheetWEB way before they will buy it.

Pagos is in BI business since 2002, profitable and fully self-funded since inception, with hundreds of customers. Pagos has other advanced BI-related products, like SpreadsheetLIVE (it offers a fully featured spreadsheet application environment within a web browser) and Pagos Spreadsheet Component (allows software developers to create web and desktop applications that can read, execute, and create Excel spreadsheets without requring Microsoft Excel). If you will compare SpreadsheetWEB with Microsoft's own attempt to webify Excel and Microsoft's own Long List of Unsupported Excel features, you can easily appreciate the significance of what Pagos achieved!

Permalink: http://apandre.wordpress.com/2011/03/13/spreadsheetweb/

20110214

"Quadrant" for Data Visualization Platforms

For many years, Gartner keeps annoying me every January by publishing so called "Magic Quadrant for Business Intelligence Platforms" (MQ4BI for short) and most vendors (mentioned in it; this is funny, even Donald Farmer quotes MQ4BI) almost immediately re-published it either on so-called reprint (e.g. here - for a few months) area of Gartner website or on own website; some of them also making this "report" available to web visitors in exchange for contact info - for free. To channel my feeling toward Gartner  to a  something constructive, I decided to produce my own "Quadrant" for Data Visualization Platforms (DV "Quadrant" or Q4DV for short) - it is below and is a work in-progress and will be modified and republished overtime:


3 DV Leaders (green dots in upper right corner of Q4DV above) compared with each other and with Microsoft BI stack on this blog, as well as voted in DV Poll on LinkedIn. MQ4BI report actually contains a lot of useful info and it deserved to be used as a one of possible data sources for my new post, which has more specific target - Data Visualization Platforms. As I said above, I will call it Quadrant too: Q4DV. But before I will do that, I have to comment on Gartner's annual MQ4BI.


MQ4BI customer survey included vendor-provided references, as well as survey responses from BI users in Gartner's BI summit and inquiry lists. There were 1,225 survey responses (funny enough, almost the same number of responces as on my DV Poll on LinkedIn), with 247 (20%) from non-vendor-supplied reference lists. Magic Quadrant Customer Survey's results the Gartner promised to publish in 1Q11. The Gartner has a somewhat reasonable "Inclusion and Exclusion Criteria" (for Data Visualization Q4DV I excluded some vendors from Gartner List and included a few too), almost tolerable but a fuzzy BI Market Definition (based on 13 loosely pre-defined capabilities organized into 3 categories of functionality: integration, information delivery and analysis).

I also partially agree with the definition and the usage of "Ability to Execute" as one  (Y axis) of 2 dimensions for bubble Chart above (called the same way as entire report "Magic Quadrant for Business Intelligence Platforms"). However I disagree with Gartner's order of vendors in their ability to execute and for DV purposes I had to completely change order of DV Vendors on X axis ("Completeness of Vision").

For Q4DV purposes I am reusing Gartner's MQ as a template, I also excluded almost all vendors, classified by Gartner as niche players with lower ability to execute (bottom-left quarter of MQ4BI), except Panorama Software (Gartner put Panorama to a last place, which is unfair) and will add the following vendors: Panopticon, Visokio, Pagos and may be some others after further testing.

I am going to update this DV "Quadrant", using the method suggested by Jon Peltier: http://peltiertech.com/WordPress/excel-chart-with-colored-quadrant-background/ - Thank you Jon! I hope I will have time before end of 2011 for it...

Permalink: http://apandre.wordpress.com/2011/02/13/q4dv/

20110126

Poll about Data Visualization tools

On New Year Eve I started on LinkedIn the Poll "What tool is better for Data Visualization?" and 1340 people voted there (which is unusually high return for LinkedIn polls, most of them getting less then 1000 votes), in average one vote per hour during 8 weeks, which is statistically significant as a reflection of the fact that the Data Visualization market has 3 clear leaders (probably at least a generation ahead of all other competitors: Spotfire, Tableau and Qlikview. Spotfire is a top vote getter: as of 2/27/11, 1pm EST: Spotfire got 450 votes (34%), Tableau 308 (23%), Qlikview 305 (23% ; Qlikview result improved during last 3 weeks of this poll), PowerPivot 146 (11%, more votes then all "Other" DV Tools) and all Others DV tools got just 131 votes (10%). Poll got 88 comments (more then 6% of voters commented on poll!) , will be open for more unique voters until 2/27/11, 7pm and its results consistent during last 5 weeks, so statistically it represents the user preferences of the LinkedIn population:


URL is http://linkd.in/f5SRw9 but you need to login to LinkedIn.com to vote. Also see some demographic info (in somewhat ugly visualization by ... LinkedIn) about poll voters below:


Interesting that Tableau voters are younger then for other DV tools and more then 82% voters in poll are men. Summary of some comments:

  • - poll's question is too generic - because an answer partially depends on what you are trying to visualize;

  • - poll is limited by LinkedIn restrictions, which allows no more than 5 possible/optional answers on Poll's question;

  • - poll's results may correlate with number of Qlikview/Tableau/Spotfire groups (and the size of their membership) on LinkedIn and also ability of employees of vendors of respective tools to vote in favor of the tool, produced by their company (I don't see this happened). LinkedIn has 85 groups, related to Qlikview (with almost 5000 members), 34 groups related to Tableau (with 2000+ members total) and 7 groups related to Spotfire (with about 400 members total).

  • Randall Hand posted interesting comments about my poll here:    http://www.vizworld.com/2011/01/tool-data-visualization/#more-19190 . I disagreed with some of Randall's assessments that "Gartner is probably right" (in my opinion Gartner is usually wrong when it is talking about BI, I posted on this blog about it and Randall agreed with me) and that "IBM & Microsoft rule ... markets". In fact IBM is very far behind (of Qlikview, Spotfire and Tableau) and Microsoft, while has excellent technologies (like PowerPivot and SSAS) are behind too, because Microsoft made a strategic mistake and does not have a visualization product, only technologies for it.

  • Spotfire fans from Facebook had some "advise" from here: http://www.facebook.com/TIBCOSpotfire (post said "TIBCO Spotfire LinkedIn users: Spotfire needs your votes! Weigh in on this poll and make us the Data Visualization tool of choice..." (nothing I can do to prevent people doing that, sorry). I think that the poll is statistically significant anyway and voters from Facebook may be added just a couple of dozens of votes for ... their favorite tool.

  • Among Other Data Visualization tools, mentioned in 88 comments so far were JMP, R, Panopticon, Omniscope (from Visokio), BO/SAP Explorer and Excelsius, IBM Cognos, SpreadsheetWEB, IBM's Elixir Enterprise Edition, iCharts, UC4 Insight, Birst, Digdash, Constellation Roamer, BIme, Bissantz DeltaMaster, RA.Pid, Corda Technologies, Advizor, LogiXml,TeleView etc.


Permalink: http://apandre.wordpress.com/dvpoll/

20110116

Big Data Analytics: Signal-to-Noise ratio even lower then in BI?

"Big Data Analytics" (BDA) is going to be a new buzzword for 2011. The same and new companies (and in some cases even the same people) who tried for 20+ years to use the term BI in order to sell their underused software now trying to use the new term BDA in hope to increase their sales and relevancy. Suddenly one of main reasons why BI tools are underused is a rapidly growing size of data.


Now new generation of existing tools (Teradata, Exadata, Netezza, Greenplum, PDW  etc.) and of course "new" tools (can you say VoltDB, Aster Data (Teradata now!), nPario "Platform". Hadoop, MapReduce, Cassandra, R, HANA, Paradigm4, MPP appliances etc. which are all cool and hot at the same time) and companies will enable users to collect, store, access and manipulate much larger datasets (petabytes).


For users, the level of noise will be now much bigger than before (and SNR - Signal-to-Noise ratio will be lower), because BDA is solving a HUGE (massive amounts of data are everywhere, from genome to RFID to application and network logfiles  to health data etc.) backend problem, while users interact with front-end and concern about trends, outliers, clusters, patterns, drilldowns and other visually intensive data phenomenas. However, SNR can be increased if  BDA technologies will be used together and as supporting tools to the signal-producing tools which are ... Data Visualization tools.


Example of that can be a recent partnership between Tableau Software and Aster Data (Teradata bought Aster Data in March 2011!). I know for sure that EMC trying to partner Greenplum with most viable Data Visualizers, Microsoft will integrate its PDW with PowerPivot and Excel and I can assume of how to integrate Spotfire with BDA. Integration of Qlikview with BDA can be more difficult, since Qlikview currently can manipulate only data in own memory. In any case, I see DV tools as the main attraction and selling point for end-users and I hope BDA vendors can/will understand this simple truth and behave accordingly.


Permalink: http://apandre.wordpress.com/2011/01/16/bigdata/

20110109

Donald Farmer moved from Microsoft to Qliktech

I never saw before when one man moved from one company to another, then 46+ people will almost immediately comment on it. But this is what happened during last few days, when Donald Farmer, the Principal Program Manager for Microsoft BI Platform for 10 years, left Microsoft for Qliktech. Less than one year ago, Donald compared Qlikview and PowerPivot and while he was respectful to Qlikview, his comparison favored PowerPivot and Microsoft BI stack. I can think/guess about multiple reasons why (and I quote him: "I look forward to telling you more about this role and what promises to be a thrilling new direction for me with the most exciting company I have seen in years") he did it, for example:

  • Microsoft does not have a DV Product (and one can guess that Donald wants to be the "face" of the product),

  • Qliktech had a successful IPO and secondary offering (money talks, especially when 700-strong company has $2B market capitalization and growing),

  • lack of confidence in Microsoft BI Vision (one can guess that Donald has a different "vision"),

  • SharePoint is a virus (SharePoint created a billion dollar industry, which one can consider wasted),

  • Qlikview making a DV Developer much more productive (a cool 30 to 50 times more productive) than Microsoft's toolset (Microsoft even did not migrate the BIDS 2008 to Visual Studio 2010!),

  • and many others (Donald said that for him it is mostly user empowerment and user inspiration by Qlikview - sounds like he was underinspired with Microsoft BI stack so is it just a move from Microsoft rather then move  to Qliktech? - I guess I need a better explanation),


but Donald did explain it in his next blog post: "QlikView stands out for me, because it not only enables and empowers users; QlikView users are also inspired. This is, in a way, beyond our control. BI vendors and analysts cannot prescribe inspiration". I have to be honest - and I repeat it again - I wish a better explanation... For  example, one my friend made a "ridiculous guess" that Microsoft sent Donald inside Qliktech to figure out if it does make sense to buy Qliktech and when (I think it is too late for that, but at least it is an interesting thought: good/evil  buyer/VC/investor will do a "due diligence" first, preferably internal and "technical due diligence" too) to buy it and who should stay and who should go.

I actually know other people recently moved to Qliktech (e.g. from Spotfire), but I have a question for Donald about his new title: "QlikView Product Advocate". According to http://dictionary.reference.com/ the Advocate is a person who defends, supports and promotes a cause. I will argue that Qlikview does not need any of that (no need to defend it for sure, Qlikview has plenty of Supporters and Promoters); instead Qlikview needs a strong strategist and visionary

(and Donald is the best at it) who can lead and convince Qliktech to add new functionality in order to stay ahead of competition with at least Tableau, Spotfire and Microsoft included. One of many examples will be an ability to read ... Microsoft's SSAS multidimensional cubes, like Tableau 6.0 and Omniscope 2.6 have now.

Almost unrelated - I updated this page:  http://apandre.wordpress.com/market/competitors/qliktech/

Permalink: http://apandre.wordpress.com/2011/01/09/farmer_goes_2_qlikview/

20101225

Happy New 2011 Year!

Happy holidays to visitors of this blog and my best wishes for 2011! December 2010 was so busy for me, so I did not have time to blog about anything. I will just mention some news in this last post of 2010.

Tableau sales will exceed $40M in 2010 (and they planning to employ 300+ by end of 2011!), which is almost 20% of Qliktech sales in 2010. My guesstimate (if anybody has better data, please comment on it) that Spotfire's sales in 2010 are about $80M. Qliktech's market capitalization exceeded recently $2B, more than twice of Microstrategy ($930M as of today) Cap!

I recently noticed that Gartner trying to coin the new catch phrase because old (referring to BI, which never worked because intelligence is attribute of humans and not attribute of businesses) does not work. Now they are saying that for last 20+ years when they talked about business intelligence (BI) they meant an intelligent business. I think this is confusing because (at least in USA) business is all about profit and Chief Business Intelligent Dr. Karl Marx will agree with that. I respect the phrase "Profitable Business" but "Intelligent Business" reminds me the old phrase "Crocodile tears". Gartner also saying that BI projects should be treated as a "cultural transformation" which reminds me a road paved with good intentions.

I also noticed the huge attention paid by Forrester to Advanced Data Visualization and probably for 4  good reasons (I have the different reasoning, but I am not part of Forrester) :

  • data visualization can fit much more (tens of thousands) data points into one screen or page compare with numerical information and datagrid ( hundreds datapoints per screen);

  • ability to visually drilldown and zoom through interactive and synchronized charts;

  • ability to convey a story behind the data to a wider audience through data visualization.

  • analysts and decision makers cannot see patterns (and in many cases also trends and outliers) in data without data visualization, like 37+ years old example, known as Anscombe’s quartet, which comprises four datasets that have identical simple statistical properties, yet appear very different when visualized. They were constructed by F.J. Anscombe to demonstrate the importance of Data Visualization (DV):


Anscombe's quartet
IIIIIIIV
xyxyxyxy
10.08.0410.09.1410.07.468.06.58
8.06.958.08.148.06.778.05.76
13.07.5813.08.7413.012.748.07.71
9.08.819.08.779.07.118.08.84
11.08.3311.09.2611.07.818.08.47
14.09.9614.08.1014.08.848.07.04
6.07.246.06.136.06.088.05.25
4.04.264.03.104.05.3919.012.50
12.010.8412.09.1312.08.158.05.56
7.04.827.07.267.06.428.07.91
5.05.685.04.745.05.738.06.89


In 2nd half of 2010 all 3 DV leaders released new versions of their beautiful software: Qlikview, Spotfire and Tableau. Visokio's Omniscope 2.6 will be available soon and I am waiting for it since June 2010... In 2010 Microsoft, IBM, SAP, SAS, Oracle, Microstrategy etc. all trying hard to catch up with DV leaders and I wish to all of them the best of luck in 2011. Here is a list of some other things I still remember from 2010:

  • Microsoft officially declared that it prefers BISM over OLAP and will invest into their future accordingly. I am very disappointed with Microsoft, because it did not include BIDS (Business Intelligence Development Studio) into Visual Studio 2010. Even with release of supercool and free PowerPivot it is likely now that Microsoft will not be a leader in DV (Data Visualization), given it discontinued ProClarity and PerformancePoint and considering ugliness of SharePoint. Project Crescent (new visualization "experience" from Microsoft) was announced 6 weeks ago, but still not too many details about it, except that it mostly done with Silverlight 5 and Community Technology Preview will be available in 1st half of 2011.

  • SAP bought Sybase, released new version 4.0 of Business Objects and HANA "analytic appliance"

  • IBM bought Netezza and released Cognos 10.

  • Oracle released OBIEE 11g with ROLAP and MOLAP unified

  • Microstrategy released its version 9 Released 3 with much faster performance, integration with ESRI and support for web-serviced data

  • EMC bought Greenplum and started new DCD (Data Computing Division), which is obvious attempt to join BI and DV market

  • Panorama released NovaView for PowerPivot, which is natively connecting to the PowerPivot in-memory models.

  • Actuate's BIRT was downloaded 10 million times (!) and has over a million (!) BIRT developers

  • Panopticon 5.7 was released recently (on 11/22/10) and adds the ability to display real-time streaming data.


David Raab, one of my favorite DV and BI gurus, published on his blog the interesting comparison of some leading DV tools. According to David' scenario, one of possible ranking of DV Tools can be like that: Tableau is 1st than  Advizor (version 5.6 available since June 2010), Spotfire and Qlikview (seems to me David implied that order). In my recent DV comparison "my scenario" gave a different ranking: Qlikview is slightly ahead, while Spotfire and Tableau are sharing 2nd place (but very competitive to Qlikview) and Microsoft is distant 4th place, but it is possible that David knows something, which I don't...

In addition to David, I want to thank  Boris Evelson, Mark Smith, Prof. Shneiderman, Prof. Rosling, Curt Monash, Stephen Few and others for their publications, articles, blogs and demos dedicated to Data Visualization in 2010 and before.

Permalink: http://apandre.wordpress.com/2010/12/25/hny2011/

20101203

Columnstore index in SQL Server 11.0 will accelerate DW queries by 100X

Microsoft reused its patented VertiPaq column-oriented DB technology in upcoming SQL Server 11.0 release by introducing columnstore indexes, where each columns stored in separate set of disk pages. Below is a "compressed" extraction from Microsoft publication and I think it is very relevant to the future of Data Visualization techologies. Traditionally RDBMS uses "row store" where


heap or a B-tree contains multiple rows per page. The columns are stored in different groups of pages in the columnstore index. Benefits of this are:

  • only the columns needed to solve a query are fetched from disk (this is often fewer than 15% of the columns in a typical fact table),

  • it’s easier to compress the data due to the redundancy of data within a column, and

  • buffer hit rates are improved because data is highly compressed, and frequently accessed parts of commonly used columns remain in memory, while infrequently used parts are paged out.


"The columnstore index in SQL Server employs Microsoft’s patented Vertipaq™ technology, which it shares with SQL Server Analysis Services and PowerPivot. SQL Server columnstore indexes don’t have to fit in main memory, but they can effectively use as much memory as is available on the server. Portions of columns are moved in and out of memory on demand." SQL Server is the first major database product to support a pure Columnstore index. Columnstore recommended for fact tables in DW in datawarehouse, for large dimensions (say with more than 10 millions of records) and any large tables designated to be used as read-only.

"In memory-constrained environments when the columnstore working set fits in RAM but the row store working set doesn’t fit, it is easy to demonstrate thousand-fold speedups. When both the column store7and the row store fit in RAM, the differences are smaller but are usually in the 6X to 100X range for star join queries with grouping and aggregation." Your results will of course depend on your data, workload, and hardware. Columnstore index query processing is most heavily optimized for star join queries. OLTP-style queries, including point lookups, and fetches of every column of a wide row, will usually not perform as well with a columnstore index as with a B-tree index.

Columnstore compressed data with a factor of 4 to a factor of 15 compression with different fact tables. The columnstore index is a secondary index; the row store is still present, though during query processing it is often not need, and ends up being paged out. A clustered columnstore index, which will be the master copy of the data, is planned for the future. This will give significant space savings.

Tables with columnstore indexes can’t be updated directly using INSERT, UPDATE, DELETE, and MERGE statements, or bulk load operations. To move data into a columnstore table you can switch in a partition, or disable the columnstore index, update the table, and rebuild the index. Columnstore indexes on partitioned tables must be partition-aligned. Most data warehouse customers have a daily, weekly or monthly load cycle, and treat the data warehouse as read-only during the day, so they’ll almost certainly be able to use columnstore indexes.You can also create a view that uses UNION ALL to combine a table with a column store index and an updatable table without a columnstore index into one logical table. This view can then be referenced by queries. This allows dynamic insertion of new data into a single logical fact table while still retaining much of the performance benefit of columnstore capability.

Most important for DV systems is this statement: "Users who were using OLAP systems only to get fast query performance, but who prefer to use the T-SQL language to write queries, may find they can have one less moving part in their environment, reducing cost and complexity. Users who like the sophisticated reporting tools, dimensional modeling capability, forecasting facilities, and decision-support specific query languages that OLAP tools offer can continue to benefit from them. Moreover, they may now be able to use ROLAP against a columnstore-indexed SQL Server data warehouse, and meet or exceed the performance they were used to in the past with OLAP, but save time by eliminating the cube building process". This sounds like Microsoft finally figured out of how to compete with Qlikview (technology-wise only, because Microsoft still does not have - may be intentionally(?) - DV product).

Permalink: http://apandre.wordpress.com/2010/12/03/columnstore-index/

20101201

SAP HANA scales linearly

SAP released HANA today which does in-memory computing with in-memory database. Sample appliance with 10 blades with 32 cores (using XEON 7500) each; sample (another buzzword: "data source agnostic") appliance costs approximately half-million of dollars. SAP claimed that"Very complex reports and queries against 500 billion point-of-sale records were run in less than one minute" using parallel processing. SAP HANA "scales linearly" with performance proportional to hardware improvements that enable complex real-time analytics.

Pricing will likely be value based and that it is looking for an all-in figure of around $10 million per deal. Each deal will be evaluated based upon requirements and during the call, the company confirmed that each engagement will be unique (so SAP is hoping for 40-60 deals in pipeline).

I think with such pricing and data size the HANA appliance (as well as other pricey data appliances) can be useful mostly in 2 scenarios:

  • when it integrates with mathematical models to enable users to discover patterns, clusters, trends, outliers and hidden dependencies and

  • when those mountains of data can be visualized, interactively explored and searched, drilled-down and pivot...


8/8/11 Update: The 400 million-euro ($571 million) pipeline for Hana, which was officially released in June, is the biggest in the history of Walldorf, Germany-based SAP, the largest maker of business-management software. It’s growing by 10 million euros a week, co-Chief Executive Officer Bill McDermott said last month. BASF, the world’s largest chemical company, has been able to analyze commodity sales 120 times faster with Hana, it said last month. Russian oil producer OAO Surgutneftegas, which has been using Hana in test programs since February, said the analysis of raw data directly from the operational system made additional data warehouse obsolete.

Permalink: http://apandre.wordpress.com/2010/12/01/sap-hana/

20101120

Microsoft BI: Roadmap to where?

Microsoft used to be a greatest marketing machine in software industry. But after loosing search business to Google and smartphone business to Apple and Google they lost their winning skills. It is clear now that this is also true in so called BI Market (Business Intelligence is just a marketing term).  Microsoft bought ProClarity and it disappeared, they released PerformancePoint Server and it is disappearing too. They have (or had?) the best BI Stack (SQL Server 2008 R2 and its Analysis Services, Business Intelligence Development Studio 2008 (BIDS), Excel 2010, PowerPivot etc.) and they failed to release any BI or Data Visualization Product, despite having all technological pieces and components. Microsoft even released Visual Studio 2010 without any support for BIDS and recently they talked about their Roadmap for BI and again - they delayed the mentioning of BIDS 2010 and they declared NO plans for BI or DV products! Instead they are talking about "new ad hoc reporting and data visualization experience codenamed “Project Crescent”"!

And than they have a BISM model as a part of Roadmap: "A new Business Intelligence Semantic Model (BISM) in Analysis Services that will power Crescent as well as other Microsoft BI front end experiences such as Excel, Reporting Services and SharePoint Insights".

Experience and Model instead of Product? What Microsoft did with PowerPivot is clear: they gave some users the reason to upgrade to Office 2010, and as a result, Microsoft preserved and protected (for another 2 years?) their lucrative Office business but diminished their chances to get a significant pie of $11B (and  growing 10% per year) BI Market. new BISM (Business Intelligence Semantic Model) is a clear sign of losing technological edge:

image

I have to quote (because they finally admitted that BIDS will be  replaced by BISM - when "Project Juneau" will be available): "The BI Semantic Model can be authored by BI professionals in the Visual Studio 2010 environment using a new project type that will be available as part of “Project Juneau”. Juneau is an integrated development environment for all of SQL Server and subsumes the Business Intelligence Development Studio (BIDS). When a business user creates a PowerPivot application, the model that is embedded inside the workbook is also a BI Semantic Model. When the workbook is published to SharePoint, the model is hosted inside an SSAS server and served up to other applications and services such as Excel Services, Reporting Services, etc. Since it is the same BI Semantic Model that is powering PowerPivot for Excel, PowerPivot for SharePoint and Analysis Services, it enables seamless transition of BI applications from Personal BI to Team BI to Organizational (or Professional) BI."

Funniest part of this quote above that Microsoft is honestly believe that SharePoint is not a Virus but a viable Product and it will escape the fate of its "step-brother" - PerfromancePoint Server. Sweet dreams! It is clear that Microsoft failed to understand that Data Visualization is the future of BI market and they keep recycling for themselves the obvious lie "Analysis Services is the industry leading BI platform in this space today"! Indirectly they acknowledged it in a very next statement : "With the introduction of the BI Semantic Model, there are two flavors of Analysis Services – one that runs the UDM (OLAP) model and one that runs the BISM model". Hello?

Why we need 2 BI Models instead of 1 BI product? BIDS 2008 itself is already buggy and much less productive development environment than Qlikview, Spotfire and Tableau, but now Microsoft wants us to be confused with 2 co-existing approaches: OLAP and BISM? And now get this: "you should expect to see more investment put into the BISM and less in the UDM(OLAP)"!

Dirty Harry will say in such situation: "Go ahead, make my day!" And I guess that Microsoft  does not care that Apple's  Market CAP is larger than Microsoft now.


Afterthought (looking at this from 2011 point of view): I am thinking now that I know why Donald Farmer left Microsoft 2 months after BISM announcement above.

p010: http://wp.me/pCJUg-7r

20101110

Tableau 6 reads local PowerPivot, does Motion Chart

It looks like honeymoon for Qlikview after Qliktech's IPO is over. In addition to Spotfire 3.2/Silver, now we have the 3rd great piece of software in form of Tableau 6. Tableau 6.0 released today (both 32-bit and 64-bit) with new in-memory data engine (very fast, say 67 millions of rows in 2 seconds) and quick data blending from multiple data sources while normalizing across them. Data Visualization Software available as a Server (with web browsers as free Clients) and as a Desktop (Pro for $1999, Personal for $999, Reader for free).

New Data Sources include local PowerPivot files(!),  Aster Data ; new Data Connections include OData , (recently released) Windows Azure Marketplace Datamarket; Data Connection can be Direct/Live or to in-memory data engine. Tableau 6 does full or partial automatic data updates; supports parameters for calculations, what-if modeling, and selectability of Displaying fields in Chart's axis; combo charts of any pair of charts; has new project views, supports Motion Charts

tumblr_mssaaxhajz1stz40uo1_500

(a la Hans Rosling) etc. Also see Ventana Research and comments by Tableau followers. This post can be expanded, since it is officially 1st day of release.

n009: http://wp.me/sCJUg-tableau6