20131011

Spotfire 6 is announced

Yesterday TIBCO announced Spotfire 6 with features, competitive with Tableau 8.1 and Qlikview.Next (a.k.a Qlikview 12). 
Some new features will be showcased at TUCON® 2013, TIBCO's annual user conference, October 14-17, 2013, and more details will be shown in webcasts and webinars (I personally prefer detailed articles, blogposts, slides, PDFs and Demos, but TIBCO's corporate culture ignores my preferences for years) on 10/30/13 by Steve Farr
Spotfire 6.0 will be available in mid-November, presumably the same time as Tableau 8.1 and before then Qlikview.Next so TIBCO is not a loser in Leap-frogging game for sure...
TIBCO bought the Extended Results and will presumably will show the integration with PSUHBI product, see it here: http://www.pushbi.com/ ; TIBCO called it as Delivery of  personal KPIs and Metrics on any mobile phone, tablet or laptop, online or offline (new name for it will be TIBCO Spotfire® Consumer):
ipadiphone
Another TIBCO's Purchase is MAPORAMA and integration with it TIBCO called (very appropriately) as the Location Analytics with promise to
  • Visualize, explore and analyze data in the context of location
  • Expand situational understanding with multi-layered geo-analytics
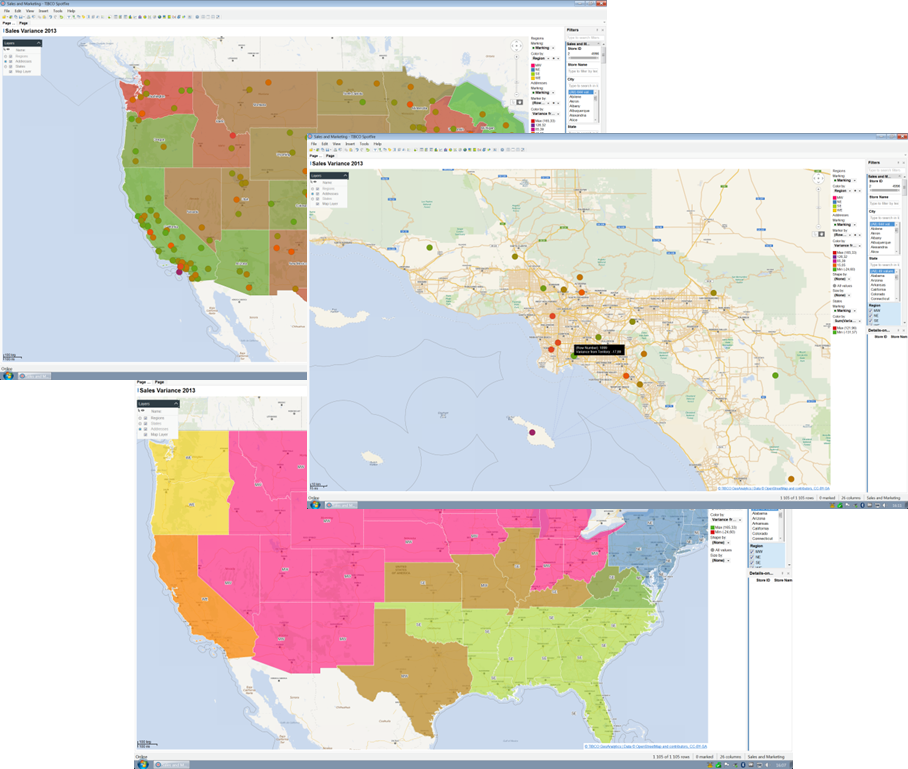
Mashup new data sources to provide precise geo-coding across the enterprise
la1

Spotfire Location Services is the Agnostic Platform and supports (I guess this needs to be verified, because sounds too good to be true) any map service, including own TIBCO, ESRI (Spotfire integrates with ESRI previously), Google:
GeoCodingSP6

TIBCO has Event processing capabilities (e.g StreamBase, they bought a few months ago, see it here: http://www.streambase.com/news-and-events/press-releases/pr-2013/tibco-software-acquires-streambase-systems/#axzz2hiEjnr9X) and it will be interesting to see the new Events Analytics product (see also: http://www.streambase.com/products/streambasecep ) integrated with Spotfire 6:
  • Identify new trends and outliers with continuous process monitoring
  • Automate the delivery of analytics applications based on trends
  • Operationalize analytics to support continuous process improvement:ea1
One more capability in Spotfire mentioned (this claim needs to be verified) in recent TIBCO blogpost http://www.tibco.com/blog/2013/10/11/connecting-the-loops-the-next-step-in-decision-management/ as the ability to overlap 2 related but separated in real-life processes: the processes of analysis (discovery of insights in data) and execution (deciding and actions) could be separated by days, but with Spotfire 6.0 the entire decision process can happen in real time:

spotfireloops

For business user Spotfire 6 has new web-based authoring (Spotfire has a few "Clients", one called Web Player and another called Enterprise Player, both are not free unlike Tableau Free Reader or Tableau Public). Bridging the gap between simple dashboards and advanced analytic applications, Spotfire 6.0 provides a new client "tailored to meet the needs of the everyday business user, who typically has struggled to manipulate pivot tables and charts to address their data discovery needs".

With this new web application, known as TIBCO Spotfire® Business Author, business users can visually explore and interact with data, whether residing in a simple spreadsheet or dashboard, a database, or a predefined analytic application. It will definitely compete with Web Authoring in Tableau 8.1 and incoming Qlikview.Next.

For me personally the most interesting new feature is new Spotfire Cloud Services (supposedly the continuation of Spotfire SIlver, which I like but it is overpriced and non-competitive storage-wise vs. Tableau Public and Tableau Online cloud services). Here is the quote from yesterday's Press Release: "TIBCO Spotfire® Cloud is a new set of cloud services for enterprises, work groups, and personal use (see some preliminary info here: https://marketplace.cloud.tibco.com/marketplace/marketplace/apps#/sc :

  • Personal: Web-based product, Upload Excel, .csv and .txt data, 12 visualization types, 100 GB of data storage
  • Workgroup: Web-based and desktop product, Connect and integrate multiple data sources, All visualization types, 250 GB of data storage
  • Enterprise: Web-based and desktop product, Connect to 40+ data sources, All visualization types, Advanced statistics services, 500 GB of data storage
TIBCO Spotfire® Cloud Enterprise provides a secure full-featured version of Spotfire in the cloud to analyze and collaborate on business insights, whether or not the data is hosted. For project teams seeking data discovery as a service, TIBCO Spotfire® Cloud Work Group provides a wealth of application-building tools so distributed teams can visually explore data quickly and easily and deploy analytic applications at a very low cost. For individuals looking for a single step to actionable insight, TIBCO Spotfire®Personal is a cost-effective web-based client for quick data discovery needs."

Spotfire 6 has enterprise-class, R-compatible statistical engine: TIBCO Enterprise Runtime for R (TERR) which is  the part of excellent TIBCO Spotfire Statistics Services (TSSS). TSSS allows Integration of R (including TERR), Spotfire's own S+ (SPlus is Spotfire's commercial version of R), SAS® and MATLAB® into Spotfire and custom applications. TERR, see http://spotfire.tibco.com/en/discover-spotfire/what-does-spotfire-do/predictive-analytics/tibco-enterprise-runtime-for-r-terr.aspx supports:

  • Support for paralelized R-language scripts in TERR
  • Support for call outs to open source R from TERR
  • Use RStudio – the most popular IDE in the R Community-to develop your TERR scripts
  • Over a thousand TERR compatible CRAN packages
Among other news is support for new Data Sources: http://spotfire.tibco.com/en/resources/support/spotfire-data-sources.aspx including SAP NetWeaver Business Warehouse v.7.0.1 (required TIBCO Connector Link).

General note: I maintain my opinion that the best way for TIBCO to capitalize on tremendous hidden market value of Spotfire is to spin-it off as EMC did with VMWare. My other concern is too many offices involved with Spotfire: (Parental) TIBCO's HQ in California, R&D office in Sweden and Main marketing, sales and consulting office in Massachusetts. My advise to have only one main office in MA, which is compatible with spin-off idea. Tableau has advantage here with concentrating their main office in Seattle.
20131006

The BI is a dead horse, long live the DV!

Last month Tableau and Qliktech both declared that Traditional BI is too slow (I am saying this for many years) for development and their new Data Visualization (DV software) is going to replace it. Quote from Tableau's CEO: Christian Chabot: "Traditional BI software is obsolete and dying and this is very direct challenge and threat to BI vendors: your (BI that is) time is over and now it is time for Tableau." Similar quote from Anthony Deighton, Qliktech's CTO & Senior VP, Products: "More and more customers are looking at QlikView not just to supplement traditional BI, but to replace it".

One of my clients - large corporation (obviously cannot say the name of it due NDA) asked me to advise of what to choose between Traditional BI tools with long Development Cycle (like Cognos, Business Objects or Microstrategy), modern BI tools (like JavaScript and D3 toolkit) which is attempt to modernize traditional BI but still having  sizable development time and leading Data Visualization tools with minimal development time (like Tableau, Qlikview or Spotfire).

Since main criterias for client were
  • minimize IT personnel involved and increase its productivity;
  • minimize the off-shoring and outsourcing as it limits interactions with end users;
  • increase end users's involvement, feedback and action discovery.
So I advised to client to take some typical Visual Report project from the most productive Traditional  BI Platform (Microstrategy), use its prepared Data and clone it with D3 and Tableau (using experts for both). Results in form of Development time in hours) I put below; all three projects include the same time (16 hours) for Data Preparation & ETL, the same time for Deployment (2 hours) and the same number (8) of Repeated Development Cycles (due 8 consecutive feedback from End Users):

DVvsD3vsBI
It is clear that Traditional BI requires too much time, that D3 tools just trying to prolongate old/dead BI traditions by modernizing and beautifying BI approach, so my client choose Tableau as a replacement for Microstrategy, Cognos, SAS and Business Objects and better option then D3 (which require smart developers and too much development). This movement to leading Data Visualization platforms is going on right now in most of corporate America, despite IT inertia and existing skillset. Basically it is the application of the simple known principle that "Faster is better then Shorter", known in science as Fermat's Principle of least time.
This changes made me wonder (again) if Gartner's recent marketshare estimate and trends for Dead Horse sales (old traditional BI) will stay for long. Gartner estimates the size of BI market as $13B which is drastically different from TBR estimate ($30B). BIDeadHorseTheory TBR predicts that it will keep growing at least until 2018 with yearly rate 4% and BI Software Market to Exceed $40 Billion by 2018 (They estimate BI Market as $30B in 2012 and include more wider category of Business Analytics Software as opposed to strictly BI tools). I added estimates for Microstrategy, Qliktech, Tableau and Spotfire to Gartner's MarketShare estimates for 2012 here:
9Vendors

"Traditional BI is like a pencil with a brick attached to it" said Chris Stolte at recent TCC13 conference and Qliktech said very similar in its recent announcement of Qlikview.Next. I expect TIBCO will say similar about upcoming new release of Spotfire (next week at TUCON 2013 conference in Las Vegas?)

Tableau_brick2
These bold predictions by leading Data Visualization vendors are just simple application of Fermat's Principle of Least Time: this principle stated that the path taken between two points by a ray of light (or development path in our context) is the path that can be traversed in the least time.
Pierre_de_Fermat2
Fermat's principle can be easily applied to "PATH" estimates to multiple situations like in video below, where path from initial position of the Life Guard on beach to the Swimmer in Distress (Path through Sand, Shoreline and Water) explained:

Even Ants following the Fermat's Principle (as described in article at Public Library of Science here: http://www.plosone.org/article/info%3Adoi%2F10.1371%2Fjournal.pone.0059739 ) so my interpretation of this Law of Nature ("Faster is better then Shorter") that  traditional BI is a dying horse and I advise everybody to obey the Laws of Nature.

AntsOn2SurfacesIf you like to watch another video about Fermat's principle of Least Time and related Snell's law, you can watch this:

Google+

20130925

Qlikview.Next will be available in 2014

Qlikview 10 was released around 10/10/10, Qlikview 11 – around 11/11/11, so I expected Qlikview 12 to be released on 12/12/12. Qliktech press release said today that the next (after 11.2) version of Qlikview will be delivered under the new nickname Qlikview.Next in 2014 but "for  early adopter customers in a production environment in 2013". I hope I can get my hands on it ASAP!


The new buzzword is Natural Analytics: "QlikView.Next’s key value as an alternative BI platform is in its use of Natural Analytics". The new Qliktech motto that "Qlikview is a Replacement of Traditional BI" is similar to what we heard from Tableau leaders just 2 weeks ago on Tableau Customer Conference in Washington, DC.  Another themes I hear from Qliktech about Qliview.Next are sounds familiar too: Gorgeous, Genius, Visually Beautiful, Associative Experience, Comparative Analysis, Anticipatory, Drag and Drop Analytics.


Qlikview.Next will introduce "Data Dialogs" as live discussions between multiple users about Data they see and explore collectively, enabling "Social BI". This reminds me the integration between TIBBR (TIBCO's collaboration platform) and Spotfire, which existed since Spotfire 4.0.


Details about new features in Qlikview.Next will be released later, but at least we know now when Qlikview 12 (sorry, Qlikview.Next that is) will be available. Some features actually unveiled in generic terms::


  • Unified, Browser-Based HTML5 Client, which will automatically optimize itself for user' device;


  • Automatic and Intelligent re-sizing of objects to fit user's screen;


  • Server-side Analysis and Development, Web-based creation and delivery of content, Browser-based Development;


  • Data Storytelling, narrative and social with Data Dialogs;


  • Library and Repository for UI objects;


  • Multi-source Data Integration and new web-based scripting;


  • QlikView Expressor for advanced graphical Data Integration and Metadata Management;


  • Improved Data Discovery with associative experience across all the data, both in memory and on disks;


  • Open API: JSON, .NET SDK and as JavaScript API;


  • All UI Objects can be treated as extension Objects, customizable with their source files available to developers;


  • New Managment Console with Qlikview on Qlikview Monitor;


  • New visualization capabilities, based on advanced data visualization suite from NComVA (bought by Qliktech a few months ago), potential samples see here: http://www.ncomva.se/guide/?chapter=Visualizations


NComVAVisualizations11

In addition Qliktech is launching the "Qlik Customer Success Framework" , which includes:


  • Qonnect Partner Program: An extensive global network of 1500+ partners, including resellers, (OEMs), technology companies, and system integrators.


  • Qlik Community: An online community with nearly 100,000 members comprised of customers, partners, developers and enthusiasts.


  • Qlik Market: An online showcase of applications, extensions and connectors.


  • Qoncierge: A single point of contact service offering for customers to help them access the resources they need.


  • Comprehensive Services: A wide range of consulting services, training and support.


QlikFramework

Also see Ted Cuzzillo blogpost about it here: http://datadoodle.com/2013/10/09/next-for-qlik/# and Cindi Howson's old post here: http://biscorecard.typepad.com/biscorecard/2012/05/qliktech-shares-future-product-plans-for-qlikview.html and new article here: http://www.informationweek.com/software/business-intelligence/qliktech-aims-to-disrupt-bi-again/240162403#!

20130913

Data to the People: tb8.1 vs qv11.2 vs sf5.5

After announcement of Tableau 8.1 ( and completion of TCC13) this week people asked me to refresh my comparison of leading Data Visualization tools and I felt it is the good time to do it, because finally Tableau can claim it has 64-bit platform and it is able now to do more advanced Analytics, thanks to Integration with R (both new features needs to be benchmarked and tested, but until my benchmarks are completed I tend to believe to Tableau's claims).  I actually felt that Tableau may be leapfrogged the competition and now Qlikview and Spotfire have to do something about it (of course if they care).


I enjoyed this week Tableau's pun/wordplay/slogan "Data to the People" it reminds, of course, other slogan "Power to the People" but also indirectly refers to NYSE Symbol "DATA" which is the SYMBOL of Tableau Software Inc. and it means (indirectly): "Tableau to the People":


DataToThePeople2

In fact the "keynote propaganda" from Christian Chabot and Chris Stolte was so close to what I am saying for years on this blog, that I used their slogan FEBA4A ("Fast, Easy, Beautiful, Anywhere for Anyone") as the filter to include or remove from comparison any runner-ups, traditional, me-too and losing tools and vendors.


For example despite the huge recent progress Microsoft did with its BI Stack (updates in Office 2013, 365 and SQL 2012/14 of Power Pivot/View/Map/Query, SSAS, Data Explorer, Polybase, Azure Services, StreamInsight, in-Memory OLTP, Columnstore Indexing etc.) did not prevent me from removal of Microsoft's BI Stack from comparison (MSFT still trying to sell Data Visualization as a set of add-ins to Excel and SQL Server as oppose to separate product), because it it is not FEBA4A.


For similar reasons I did not include runner-ups like Omniscope, Advizor, Panopticon (it is part of Datawatch now), Panorama, traditional BI vendors, like IBM, Oracle, SAP, SAS, Microstrategy and many me-too vendors like Actuate, Pentaho, Information Builders, Jaspersoft, Jedox, Yellowfin, Bime and dozens of others. I even was able finally to rule out wonderful toolkits like D3 (because they are not for "anyone" and they require brilliant people like Mike Bostock to shine).


I was glad to see similar thinking from Tableau's CEO in his yesterday's interview here: http://news.investors.com/091213-670803-tableau-takes-on-big-rivals-oracle-sap-ibm-microsoft.htm?p=full and I quote:


"The current generation of technology that companies and governments use to try to see and understand the data they store in their databases and spreadsheets is without exception complicated, development-intensive, staff-intensive, inflexible, slow-moving and expensive. And every one of those adjectives is true for each of the market-share leaders in our industry."


Here is my brief and extremely personal (yes, opinionated but not bias) comparison of 3 leading Data Visualization (DV Comparison) platforms (if you cannot see in your browser, see screenshot below of Google Doc:


[googleapps domain="docs" dir="spreadsheet/pub" query="key=0AuP4OpeAlZ3PdDhKaDhZQklnY1FWZEg1Rk1lREd6NkE&output=html&widget=true" width="508" height="528" /]

I did not add pricing to comparison, because I cannot find enough public info about it. This is all I have:


  • https://tableau.secure.force.com/webstore


  • http://www.qlikview.com/us/explore/pricing


  • https://silverspotfire.tibco.com/us/get-spotfire/silver-spotfire-feature-matrix


  • additional pricing info for Tableau Server Core Licensing: “8 core server (enough to support 1,000 users, or 100 concurrent) for Tableau is $180k first year, about $34k every year after year 1 for maintenance”. With 8 core licensing I actually witnessed support for more then 1000 users: 1300+ active interactors, 250+ Publishers, 3000+ Viewers. I also witnessed (2+ years ago, since then price grew!) more than once that negotiation with Tableau Sales can get you down to $160K for 8 Core license with 20% every year after year 1 for maintenance (so in 2010-2011 total price was about $192K with 1 year maintenance)


  • Also one of visitors indicated to me that current pricing for 8 core Tableau 8.0 license for 1st year is $240K  now plus (mandatory?) 20-25% maintenance for 1st year... However negotiations are very possible and can save you up to 20-25% of "discount". I am aware of recent cases where 8-core license was sold (after discount) for around $195K with maintenance for 1st year for about $45K so total sale was $240K with 1st year maintenance (25% growth in price for last 3 years).


Below is a screenshot of above comparison, because some browsers (e.g. Safari or Firefox before version 24) cannot see either Google Doc embedded into WordPress or Google Doc itself:


DVComparisonSeptember2013


Please note that I did not quantify above which of 3 tools are better, it is not possible until I will repeat all benchmarks and tests (I did many of those in the past; if I will have time in the future, I can do it again) when actual Tableau 8.1 will be released (see latest here: https://licensing.tableausoftware.com/esdalt/ ). However I used above the green color for good and red color for bad (light-colored backgrounds in 3 middle columns indicated good/bad). Also keep in mind that Qliktech and TIBCO may release something new soon enough (say Qlikview 12 or they called it now Qlikview.Next and Spotfire 6), so leapfrogging game may continue.


Update 10/11/13: interesting article about Tableau (in context with Qlikview and Spotfire) by Akram Annous from SeekeingAlpha: http://seekingalpha.com/article/1738252-tableau-a-perfect-short-with-a-catalyst-to-boot . Akram is very active visitor to my blog, especially to this article above. This article only 1 month old but already needs updates due recent pre-announcements about Qlikview.Next (Qlikview 12) and Spotfire 6, which as I predicted showing that leapfrogging game continue at full speed. Akram is brave enough by "targeting" pricing for DATA shares as $55 IN 30 DAYS, $35 IN 6 MONTHS. I am not convinced yet.


frogleap4if you will see the AD below, it is not me, it is wordpress.com...

20130909

Tableau 8.1 announced, 8.2 to follow

Today Tableau Customer Conference 2013 started with 3200+ attendees from 40+ countries and 100+ industries, with 700 employees of Tableau, 240 sessions. Tableau 8.1 pre-announced today for release in fall of 2013, also version 8.2 planned for winter 2014, and Tableau 9.0 for later in 2014.


Update 9/10/13: keynote now is available recorded and online:  http://www.tableausoftware.com/keynote
(Recorded Monday Sept 9, 2013 Christian Chabot, Chris Stolte and the developers LIVE)

New in 8.1: 64-bit, Integration with R, support for SAML, IPV6 and External Load Balancers, Copy/Paste Dashboards and worksheets between workbooks, new Calendar Control, own visual style, including customizing even filters, Tukey's Box-and-Whisker Box-plot, prediction bands, ranking, visual analytics for everyone and everywhere (in the cloud now)


Planned and new for 8.2: Tableau for MAC, Story Points (new type of worksheet/dashboard with mini-slides as story-points), seamless access to data via data connection interface to visually build a data schema, including inner/left/right/outer visual joins, beautifying columns names, easier metadata etc, Web authoring enhancements (it may get into 8.1: moving quick filters, improvement for Tablets, color encoding.) etc.


8.1:  Francois Ajenstat announced: 64-bit finally (I asked for that for many years) for server processes and for Desktop, support for SAML (single-sign-ON on Server and Desktop), IPV6, External Load Balancers:

Francois

SAML8.1: Dave Lion announced R integration with Tableau:

DaveLion

r8.1: Mike Arvold announced "Visual Analytics for everyone", including implemention of famous Tukey's Box-and-Whisker Box-plot (Spotfire has it for a while, see it here: http://stn.spotfire.com/stn/UserDoc.aspx?UserDoc=spotfire_client_help%2fbox%2fbox_what_is_a_box_plot.htm&Article=%2fstn%2fConfigure%2fVisualizationTypes.aspx ),

better forecasting, prediction bands, ranking, better heatmaps:

MikeArvold8.1: Melinda Minch announced "fast, easy, beautiful", most importantly copy/paste dashboards and worksheets between workbooks, customizing everything, including quick filters, new calendar control, own visual style, folders in Data Window etc...

MelindaMinch28.2: Jason King pre-announced the Seamless access to data via data connection interface to visually build a data schema, including inner/left/right/outer "visual" joins, beautifying columns names, default formats, new functions like DATEPARSE, appending data-set with new tables, beautifying columns names, easier metadata etc.

JasonKingSeamlessAccess2data28.2: Robert Kosara introduced Story Points (using new type of worksheet/dashboard with mini-slides as story-points) for new Storytelling functionality:

RobertKosara28.2: Andrew Beers pre-announced Tableau 8.2 on MAC and he got a very warm reception from audience for that:

AndrewBeers3Chris Stolte proudly mentioned his 275-strong development team, pre-announced upcoming Tableau Releases 8.1 (this fall), 8.2 (winter 2014) and 9.0 (later in 2014) and introduced 7 "developers" who (see above Francois, Mike, Dave, Melinda, Jason, Robert and Andrew) discussed during this keynote new features (feature list is definitely longer and wider that recent "innovations" we saw from Qlikview 11.2 and even from Spotfire 5.5):


ChrisStolte2Christian Chabot opening keynote today... He said something important: current BI Platforms are not fast, nor easy, they are not beautiful and not for anyone and they are definitely not "anywhere" but only in designated places with appropriate IT personnel (compare with Tableau Public, Tableau Online, Tableau free Reader etc.) and it is only capable to produce a bunch of change requests from one Enterprise's department to another, which will take long time to implement with any SDLC framework.


CEOChristian basically repeated what I am saying on this blog for many years, check it here http://apandre.wordpress.com/market/competitors/ : traditional BI software (from SAP, IBM, Oracle, Microstrategy and even Microsoft cannot compete with Tableau, Qlikview and Spotfire) is obsolete and dying and this is very direct challenge and threat to BI vendors (I am not sure if they understand that): your (BI that is) time is over and now it is time for Tableau (also for Qlikview and Spotfire but they are slightly behind now...).

20130908

Summer Readings from my Google+ Page

While blog preserving my observations and thoughts, it preventing me to spend enough time to read what other people thinking and saying, so I created almost 2 years ago the extension of this blog in the form of 2 Google+ pages http://tinyurl.com/VisibleData and http://tinyurl.com/VisualizationWithTableau , where I accumulated all reading pointers for myself and gradually reading those materials when I have time.

Those 2 pages magically became extremely popular (this is unintended result) with total more than 5000 Google+ followers as of today. For example here is a Chart showing monthly growth of the  number of followers for the main extension of this blog http://tinyurl.com/VisibleData :

GPFollowersMonthly

So please see below some samples of Reading Pointers accumulated over last 3 months of summer by my Google+ pages:

Author trying to simplify BigData Definition as following: "BigData Simplified: Too much data to fit into a single server": http://yottascale.com/entry/the-colorful-secrets-of-bigdata-platforms

Recent talk from Donald Farmer: http://www.wired.com/insights/2013/06/touch-the-next-frontier-of-business-intelligence/

Dmitry pointing to implementation Disaster of Direct Discovery in Qlikview 11.2: http://bi-review.blogspot.com/2013/04/first-look-at-qlikview-direct-discovery.html

Specs for Tableau in Cloud: https://www.tableausoftware.com/products/online/specs

The DB-Engines Monthly Ranking ranks database management systems according to their popularity. Turned out that only 3 DBMSes are popular: Oracle, SQL Server and MySQL:

  • http://db-engines.com/en/ranking

  • http://db-engines.com/en/ranking_trend


According to Dr. Andrew Jennings, chief analytics officer at FICO and head of FICO Labs, three main skills of data scientist are the same 3 skills I tried to find when hiring programmers for my teams 5, 10, 20 and more years ago: 1. Problem-Solving Skills. 2. Communications Skills. 3. Open-Mindedness. This makes all my hires for last 20+ years Data Scientists, right? See it here: http://www.informationweek.com/big-data/news/big-data-analytics/3-key-skills-of-successful-data-scientis/240159803

A study finds the odds of rising to another income level are notably low in certain cities, like Atlanta and Charlotte, and much higher in New York and Boston: http://www.nytimes.com/2013/07/22/business/in-climbing-income-ladder-location-matters.html

Tableau is a prototyping tool: http://tableaufriction.blogspot.com/2013/07/the-once-and-future-prototyping-tool-of.html

Why More Data and Simple Algorithms Beat Complex Analytics Models: http://data-informed.com/why-more-data-and-simple-algorithms-beat-complex-analytics-models/

New Census Bureau Interactive Map Shows Languages Spoken in America: http://www.census.gov/newsroom/releases/archives/education/cb13-143.html

Google silently open sourced a tool called word2vec, prepackaged deep-learning software designed to understand the relationships between words with no human guidance. It actually similar to known for a decade methods called PLSI and PLSA:

  • http://gigaom.com/2013/08/16/were-on-the-cusp-of-deep-learning-for-the-masses-you-can-thank-google-later/

  • https://code.google.com/p/word2vec/


“Money is not the only reward of education, yet it is surely the primary selling point used to market data science programs, and the primary motivator for students. But there’s no clear definition of data science and no clear understanding of what knowledge employers are willing to pay for, or how much they will pay, now or in the future. Already I know many competent, diligent data analysts who are unemployed or underemployed. So, I am highly skeptical that the students who will invest their time and money in data science programs will reap the rewards they have been led to expect.”: http://www.forbes.com/sites/gilpress/2013/08/19/data-science-whats-the-half-life-of-a-buzzword/

Some good blog-posts from InterWorks:

  • https://www.interworks.com/blogs/mfowler/2013/08/16/aggregating-extracts-%E2%80%93-why-and-how-would-i-do-such-thing

  • http://www.interworks.com/blogs/tspaulding/2013/08/07/understanding-layout-containers-tableau


Technique for using Tableau data blending to create a dynamic, data-driven “parameter”: http://drawingwithnumbers.artisart.org/creating-a-dynamic-parameter-with-a-tableau-data-blend/

More about Colors:

  • http://blog.visual.ly/subtleties-of-color/

  • http://blog.visual.ly/subtleties-of-color-connecting-color-to-meaning/

  • http://blog.visual.ly/subtleties-of-color-different-types-of-data-require-different-color-schemes/

  • http://interworks.co.uk/tableau/using-custom-colour-palettes/

  • http://community.qlikview.com/blogs/qlikviewdesignblog/2013/08/16/color-codes


Russian Postcodes are collected and partially visualized:

  • http://tableaumapping.bi/2013/08/23/russia-postcodes/

  • http://public.tableausoftware.com/views/RussiaPolygons/RussiaPostcodes?:embed=y&:display_count=no


http://acuitybusiness.com/blog/bid/175066/Three-Reasons-Why-Companies-Should-Outlaw-Excel

EXASolution claims to be up to 1000 times faster than traditional databases and the fastest database in the world - based on in memory computing.
http://www.exasol.com/en/exasolution/technical-details.html

web interest to Tableau and Qlikview:
http://www.google.com/trends/explore?q=qlikview%2C+tableau%2C+spotfire%2C+microstrategy#q=tableau%2C%20microstrategy%2C%20qlikview%2C%20spotfire&geo=US&date=9%2F2008%2061m&cmpt=q

20130828

Data Visualization as a Service

With releases of Spotfire Silver, Tableau Online and attempts of a few Qlikview Partners (but not Qliktech itself yet) to the Cloud and providing their Data Visualization Platforms and Software as a Service, the Attributes, Parameters and Concerns of such VaaS or DVaaS ( Visualization as a Service) are important to understand. Below is attempt to review those "Cloud" details at least on a high level (with natural limitation of space and time applied to review).

But before that let's underscore that Clouds are not in the skies but rather in huge weird buildings with special Physical and Infrastructure security likes this Data Center in Georgia:

GoogleDataCenterInGeorgiaWithCloudsAboveIt2

You can see some real old fashion clouds above the building but they are not what we are talking about. Inside Data Center you can see a lot of Racks, each with 20+ servers which are, together with all secure network and application infrastructure contain these modern "Clouds":

GoogleDataCenterInGeorgiaInside2

Attributes and Parameters of mature SaaS (and VaaS as well) include:

  • Multitenant and Scalable Architecture (this topic is too big and needs own blogpost or article). You can review Tableau's whitepaper about Tableau Server scalability here: http://www.tableausoftware.com/learn/whitepapers/tableau-server-scalability-explained

  • SLA - service level agreement with up-time, performance, security-related and disaster recovery metrics and certifications like SSAE16.

  • UI and Management tools for User Privileges, Credentials and Policies.

  • System-wide Security: SLA-enforced and monitored Physical, Network, Application, OS and Data Security.

  • Protection or/and Encryption of all or at least sensitive (like SSN) fields/columns.

  • Application Performance: Transaction processing speed, Network Latency, Transaction Volume, Webpage delivery times, Query response times

  • 24/7 high availability: Facilities with reliable and backup power and cooling, Certified Network Infrastructure, N+1 Redundancy, 99.9% (or 99.99% or whatever your SLA with clients promised) up-time

  • Detailed historical availability, performance and planned maintenance data with Monitoring and Operational Dashboards, Alerts and Root Cause Analysis


  • Disaster recovery plan with multiple backup copies of customers’ data in near real time at the disk level, a 


    multilevel backup strategy that includes disk-to-disk-to-tape data backup where tape backups serve as a secondary level of backup, not as their primary disaster recovery data source.


  • Fail-over that cascades from server to server and from data center to data center in the event of a regional disaster, such as a hurricane or flood.


While Security, Privacy, Latency and Hidden Cost usually are biggest concerns when considering SaaS/VaaS, other Cloud Concerns surveyed and visualized below. Recent survey and diagram are published by Charlie Burns this month:

CloudConcerns2013

Other survey and diagram are published by Shane Schick in October 2011 and in February of 2013 by KPMG. Here are concerns, captured by KPMG survey:

CloudConcernsKPMG

As you see above, Rack in Data Center can contain multiple Servers and other devices (like Routers and Switches, often redundant (at least 2 or sometimes N+1). Recently I designed the Hosting Data VaaS Center for Data Visualization and Business Intelligence Cloud Services and here are simplified version of it just for one Rack as a Sample.

You can see redundant network, redundant Firewalls, redundant Switches for DMZ (so called "Demilitarized Zone" where users from outside of firewall can access servers like WEB or FTP), redundant main Switches and Redundant Load Balancers, Redundant Tableau Servers, Redundant Teradata Servers, Redundant Hadoop Servers, Redundant NAS servers etc. (not all devices shown on Diagram of this Rack):

RackDiagram

20130826

Job openings as the KPI for DV vendors, take 2

20 months ago I checked how many job openings leading DV Vendors have. On 12/5/11 Tableau had 56, Qliktech had 46 and Spotfire had 21 openings. Today morning I checked their career sites again and noticed that both Tableau and Qliktech almost double their thirst for new talents, while Spotfire basically staying on the same level of hiring needs:


  • Tableau has 102(!) openings, 43 of them are engineering positions (I counted their R&D positions and openings in Operation department too) - that is huge! Update as of 9/18/13 has exactly 1000 employees. 1000th employee can be found on this pictureTableau1000Employees091813


  • Qliktech has 87 openings, 29 of them are engineering positions (I included R&D, IT, Tech Support and Consulting).


  • TIBCO/Spotfire has 24 openings, 16 of them are engineering positions (R&D, IT, Tech.Support).


BostonSkylineFromWindow


All 3 companies are Public now, so I decided to include their Market Capitalization as well. Since Spofire is hidden inside its corporate parent TIBCO, I used my estimate that Spotfire's Capitalization is about 20% of TIBCO's capitalization (which is $3.81B as of 8/23/13, see https://www.google.com/finance?q=TIBX ). As a result I have this Market Capitalization numbers for 8/23/13 as closing day:


Those 3 DV Vendors above together have almost $8B market capitalization as of evening of 8/23/13 !


Market Capitalization update as of 8/31/13: Tableau: $4.3B, Qliktech $2.9B, Spotfire (as 20% of TIBCO) - $0.72B


Market Capitalization update as of 9/4/13 11pm: Tableau: $4.39B, Qliktech $3B, Spotfire (as 20% of TIBCO) - $0.75B . Also as of today Qliktech employed 1500+ (approx. $300K revenue per year per employee), Tableau about 1000 (approx. $200K revenue per year per employee) and Spotfire about 500+ (very rough estimate, also approx. $350K revenue per year per employee)


20130812

Free rows from Market Capitalization DV Leader

Google+

Last week Tableau increased by 10-fold the capacity of Data Visualizations published with Tableau Public to a cool 1 Million rows of Data, basically to the same amount of rows, which Excel 2007, 2010 and 2013 (often used as data sources for Tableau Public) can handle these days and increased by 20-fold the storage capacity (to 1GB of free storage) of each free Tableau Public Account, see it here:


http://www.tableausoftware.com/public/blog/2013/08/one-million-rows-2072

It means that free Tableau Public Account will have the storage twice larger than Spotfire Silver's the most expensive Analyst Account (that one will cost you $4500/year). Tableau said: "Consider it a gift from us to you.". I have to admit that even kids in this country know that there is nothing free here, so please kid me not - we are all witnessing of some kind of investment here - this type of investment worked brilliantly in the past... And all users of Tableau Public are investing too - with their time and learning efforts.


And this is not all: "For customers of Tableau Public Premium, which allows users to save locally and disable download of their workbooks, the limits have been increased to 10 million rows of data at 10GB of storage space" see it here:


http://www.tableausoftware.com/about/press-releases/2013/tableau-software-extends-tableau-public-1-million-rows-data without changing the price of service (of course in Tableau Public Premium price is not fixed and depends on the number of impressions).

Out of 100+ millions of Tableau users only 40000 qualified to be called Tableau Authors, see it here  http://www.tableausoftware.com/about/press-releases/2013/tableau-software-launches-tableau-public-author-profiles so they are consuming Tableau Public's Storage more actively then others. As an example you can see my Tableau's Author Profile here: http://public.tableausoftware.com/profile/andrei5435#/ .

I will assume those Authors will consume 40000GB of online storage, which will cost to Tableau Software less then (my guess, I am open to correction from blog visitors) $20K/year just for the storage part of Tableau Public Service.

During the last week the other important announcement on 8/8/13 - Quarterly Revenue - came from Tableau: it reported the Q2 revenue of $49.9 million, up 71% year-over-year: http://investors.tableausoftware.com/investor-news/investor-news-details/2013/Tableau-Announces-Second-Quarter-2013-Financial-Results/default.aspx .

Please note that 71% is extremely good YoY growth compare with the entire anemic "BI industry", but less then 100% YoY which Tableau grew in its private past.


All these announcements above happened simultaneously with some magical (I have no theory why this happened; one weak theory is the investors madness and over-excitement about Q2 revenue of $49.9M announced on 8/8/13?) and sudden increase of the nominal price of Tableau Stock (under the DATA name on NYSE) from $56 (which is already high) on August 1st 2013 (announcement of 1 millions of rows/1GB storage for Tableau public Accounts) to $72+ today:


DATAstock812Area2

It means that the Market Capitalization of Tableau Software may be approaching $4B and sales may be $200M/year. For comparison, Tableau's direct and more mature competitor Qliktech has now the Capitalization below $3B while its sales approaching almost $500M/year. From Market Capitalization point of view in 3 moths Tableau went from a private company to the largest Data Visualization publicly-traded software company on market!

20130724

Tableau Server is in the Cloud

Competition in Data Visualization market is not only on features, market share and mindshare but also on pricing and lisensing. For example the Qlikview licensing and pricing is public for a while here: http://www.qlikview.com/us/explore/pricing and Spotfire Silver pricing public for a while too:  https://silverspotfire.tibco.com/us/silver-spotfire-version-comparison .

Tableau Desktop has 3 editions: Public (Free), Personal ($999) and Professional ($1999), see it here: http://www.tableausoftware.com/public/comparison ; in addition you can have full Desktop (read-only) experience with free Tableau Reader (neither Qlikview nor Spotfire have free readers for server-less, unlimited distribution of Visualizations, which is making Tableau a mind-share leader right away...)

The release of Tableau Server online hosting this month:  http://www.tableausoftware.com/about/press-releases/2013/tableau-unveils-cloud-business-intelligence-product-tableau-online heated the licensing competition and may force the large changes in licencing landscape for Data Visualization vendors. Tableau Server existed in the cloud for a while with tremendous success as Tableau Public (free) and Tableau Public Premium (former Tableau Digital with its weird pricing based on "impressions").

But Tableau Online is much more disruptive for BI market: for $500/year you can get the complete Tableau Server site (administered by you!) in the cloud with (initially) 25 (it can grow) authenticated by you users and 100GB of cloud storage for your visualizations, which is 200 times more then you can get for $4500/year top-of-the line Spotfire Silver "Analyst account". This Tableau Server site will be managed in the cloud by Tableau Software own experts and require nor IT personnel from your side! You may also compare it with http://www.rosslynanalytics.com/rapid-analytics-platform/applications/qlikview-ondemand .

A hosted by Tableau Software solution is particularly useful when sharing dashboards with customers and partners because the solution is secure but outside a company’s firewall. In the case of Tableau Online users can publish interactive dashboards to the web and share them with clients or partners without granting behind-the-firewall access.

Since Tableau 8 has new Data Extract API, you can do all data refreshes behind your own firewall and republish your TDE files in the cloud anytime (even automatically, on demand or on schedule) you need. Tableau Online has no minimum number of users and can scale as a company grows. At any point, a company can migrate to Tableau Server to manage it in-house. Here is some introductionla video about Tableau Online: Get started with Tableau Online.

[youtube=https://www.youtube.com/watch?v=Sf5Coei_8Cc]

Tableau Server in the cloud provides at least 3 ways to update your data (more details see here: http://www.tableausoftware.com/learn/whitepapers/tableau-online-understanding-data-updates )

TableauDesktopAsProxyForTableauServer

Here is another, more lengthy intro into Tableau BI in Cloud:

[youtube=https://www.youtube.com/watch?v=XB0HXXst32g]

Tableau as a Service is a step in right direction, but be cautious:  in practice, the architecture of the hosted version could impact performance. Plus, the nature of the product means that Tableau isn’t really able to offer features like pay-as-you-go that have made cloud-based software popular with workers. By their nature, data visualization products require access to data. For businesses that store their data internally, they must publish their data to Tableau’s servers. That can be a problem for businesses that have large amounts of data or that are prevented from shifting their data off premises for legal or security reasons. It could also create a synchronization nightmare, as workers play with data hosted at Tableau that may not be as up-to-date as internally stored data. Depending on the location of the customer relative to Tableau’s data center, data access could be slow.

And finally, the online version requires the desktop client, which costs $2,000. Tableau may implement Tableau desktop analytical features in a browser in the future while continue to support the desktop and on-premise model to meet security and regulations facing some customers.

Tableau_Online

20130711

Contractor's Rate vs. Full-Time Employee Pay

I got many questions from Data Visualization Blog's visitors about differences between compensation for full-time employees and contractors. It turned out that many visitors are actually contractors, hired because of their Tableau or Qlikview or Spotfire skills and also some visitors consider a possibility to convert to consulting or vice versa: from consulting to FullTimers. I am not expert in all these compensation and especially benefits-related questions, but I promised myself that my blog will be driven by vistors's requests, so I google a little about Contractor vs. Full-Time worker compensation and below is brief description of what I got:


Federal Insurance Contribution Act mandates Payroll Tax splitted between employer (6.2% Social Security with max $$7049.40 and 1.45% Medicare on all income) and employee, with total (2013) as 15.3% of gross compensation.


Historical_Payroll_Tax_Rates


In addition you have to take in account employer's contribution (for family it is about $1000/per month) to medical benefits of employee, Unemployment Taxes, employer's contribution to 401(k), STD and LTD (short and long term disability insurances), pension plans etc.


I also added into my estimate of contractor rate the "protection" for at least 1 month GAP between contracts and 1 month of salary as bonus for full-time employees.


RR20120507-BCC-2

Basically the result of my minimal estimate as following: you need to get as a contractor the rate at least 50% more than base hourly rate of the full-time employee. This  base hourly rate of full-time employee I calculate as employee's base salary divided on 1872 hours: 1872 = (52 weeks*40 hours - 3 weeks of vacation - 5 sick days - 6 holidays) = 2080 hours - 208 hours (Minimum for a reasonable PTO, Personal Time Off) = 1872 working hours per year.


I did not get into account any variations related to the usage of W2 or 1099 forms or Corp-To-Corp arrangements and many other fine details (like relocation requirements and overhead associated with involvement of middlemen like headhunters and recruiters) and differences between compensation of full-time employee and consultant working on contract - this is just a my rough estimate - please consult with experts and do not ask me any questions related to MY estimate, which is this:


  • Contractor Rate should be 150% of the base rate of a FullTimer


[googleapps domain="docs" dir="spreadsheet/pub" query="key=0AuP4OpeAlZ3PdEtvdGFHZnBRTjNQNmFaOWRIbGlMTXc&output=html&widget=true" width="510" height="790" /]

RS-COLLEGE LOAN SCAMS low resIn general, using Contractors (especially for business analytics) instead of Full-timers is basically the same mistake as outsourcing and off-shoring: companies doing that do not understand that their main assets are full-time people. Contractors are usually not engaged and they are not in business to preserve intellectual property of company.


Capitalist

20130607

Drill-Down Demo, using Tableau Public

http://public.tableausoftware.com/views/DrillDownDemo/Incidents?:embed=y

5 Elements of Visualization: Story is only 4th

2400 years ago the concept of Data Visualization was less known, but even than Plato said "Those who tell stories rule society".


PlatoStoryTelling

I witnessed multiple times how storytelling triggered the Venture Capitalists (VCs) to invest. Usually my CEO (biggest BS master on our team) will start with a "60-seconds-long" short Story (VCs called them "Elevator Pitch") and then (if interested) VCs will do a long Due Diligence Research of Data (and Specs, Docs and Code) presented by our team and after that they will spend comparable time analyzing Data Visualizations (Charts, Diagrams, Slides etc.) of our Data, trying to prove or disprove the original Story.


Some of conclusions from all these startup storytelling activity were:


  • Data: without Data nothing can be proved or disproved (Action needs Data!)


  • View: best way to analyze Data and trust it is to Visualize it (Seeing is Believing!)


  • Discovery of Patterns: visually discoverable trends, outliers, clusters etc. which form the basis of the Story and follow-up actions


  • Story: the Story (based on that Data) is the Trigger for the Actions (Story shows the Value!),


  • Action(s): start with drilldown to a needle in haystack, embed Data Visualization into business, it is not an Eye Candy but a practical way to improve the business


  • Data Visualization has 5 parts: Data (main), View (enabler), Discovery (visually discoverable Patterns), Story (trigger for Actions) and finally the 5th Element – Action!


  • Life is not fair: Storytellers were there people who benefited the most in the end... (no Story no Glory!).


5DVelements

And yes, Plato was correct - at least partially and for his time. Diagram above uses analogy with 5 Classical Greek Elements. Plato wrote about four classical elements (earth, air, water, and fire) almost 2400 years ago (citing even more ancient philosopher) and his student Aristotle added a fifth element, aithêr (aether in Latin, "ether" in English) - both men are in the center of 1st picture above.


Back to our time: the Storytelling is a hot topic; enthusiasts saying that "Data is easy, good storytelling is the challenge" http://www.resource-media.org/data-is-easy/#.URVT-aVi4aE or even that "Data Science is a Storytelling": http://blogs.hbr.org/cs/2013/03/a_data_scientists_real_job_sto.html . Nothing can be further from the truth: my observation is that most Storytellers (with a few known exceptions like Hans Rosling or Tableau founder Pat Hanrahan) ARE NOT GOOD at visualizing but they still wish to participate in our hot Data Visualization party. All I can say is “Welcome to the party!”


It may be a challenge for me and you but not for people who had a conference about storytelling: this winter, 2/27/13 in Nashville, KY: http://www.tapestryconference.com/ :


Some more reasonable  people referring to storytelling as a data journalism and narrative visualization: http://www.icharts.net/blogs/2013/pioneering-data-journalism-simon-rogers-storytelling-numbers


Tableau founder Pat Hanrahan recently talked about "Showing is Not Explaining". In parallel, Tableau is planning (after version 8.0) to add features that support storytelling by constructing visual narratives and effective communication of ideas, see it here:


Collection of resources on storytelling topic can be found here: http://www.juiceanalytics.com/writing/the-ultimate-collection-of-data-storytelling-resources/


You may also to check what Stephen Few thinks about it here: http://www.perceptualedge.com/blog/?p=1632


Storytelling as an important part (using Greek Analogy - 4th Classical Element (Air) after Data (Earth), View (Water) and Discovery (Fire) and before Action (Aether) ) of Data Visualization has a practical effect on Visualization itself, for example:


  • if Data View is not needed for Story or for further Actions, then it can be hidden or removed,


  • if number of Data Views in Dashboard is affecting impact of (preferably short Data Story), then number of Views should be reduced (usually to 2 or 3 per dashboard),


  • If number of DataPoints is too large per View and affecting the triggering power of the story, then it can be reduced too (in conversations with Tableau they even recommending 5000 Datapoints per View as a threshold between Local and Server-based rendering).


20130531

Tableau 8 Reading Pointers, February-May 2013

RedBinaries


  • Very popular article from Stephen Few about Tableau losing the clear vision of its youth collected 49 comments from known experts : http://www.perceptualedge.com/blog/?p=1532 and most interesting, 50th comment came from Stephen fimself: "I recently learned that when my review of Tableau 8 was published, Tableau employees were forbidden from responding publicly".


  • UK Boundary Polygon Data from Information Lab: http://www.theinformationlab.co.uk/2013/03/25/uk-area-polygon-mapping-in-tableau/


  • Sample of how to use DataExtract API with C#/.NET: http://community.tableausoftware.com/message/203714#203714


  • Tableau Data Blending, Sparse Data, Multiple Levels of Granularity, and Improvements in Version 8: http://drawingwithnumbers.artisart.org/tableau-data-blending-sparse-data-multiple-levels-of-granularity-and-improvements-in-version-8/


  • Tableau Custom SQL connections through the JET driver: https://www.interworks.com/blogs/jwright/2013/02/22/musings-tableau-custom-sql-connections-through-jet-driver


  • Software company XL Cubed has incorporated Bandlines into their product, but comments to post showing that Tableau has it fro a while too: http://www.perceptualedge.com/blog/?p=1485


  • Stepheb Few introduced Bandlines as Sparklines Enriched with Information about Magnitude and Distribution: http://www.perceptualedge.com/articles/visual_business_intelligence/introducing_bandlines.pdf


NearBy1920