Discover, Analyze, Explore, Pivot, Drilldown, Visualize your data… “How do I know what I think until I see what I say?” [E.M. Forster, G. Wallas, A. Gide]
Since Datawatch bought recently well-known swedish Data Visualization vendor Panopticon (which had 112% YoY in 2012!) for $31M in stock, Panopticon's sales for a first time added to Datawatch sales (at least $1.5M revenue per quarter), total Datawatch quarterly revenue (as expected) grew to almost $9M per quarter and to $30.3M per fiscal 2013 (ending 9/30/13).
You can compare "moving" Datawatch YoY index for last 6 quarters vs 2 Top DV Performers (Tableau above 70% YoY, Qlikview above 20%), vs similar (YoY-wise) DV Vendor (Spotfire about 12%) and finally vs 2 Traditional BI Vendors (Microstrategy and Actuate). The thickness of lines reflects Vendor's ttm (the revenue for Trailing Twelve Months) - click on Image to Enlarge:
Datawatch founded in 1985(!), public (traded on NASDAQ as DWCH) since 1992; it has 44000+ customers (including 99 of Fortune 100) and 500000+ end users. Datawatch management team is experienced in BI space and includes veterans from IBM, Applix, Cognos etc. In last 3 years (since 10/1/10) DWCH shares increased in value more then 10 times:
2nd V for BigData: Data Variety.
The first version of main Datawatch software, called Monarch Professional was released in 1991 and developed by Math Strategies. Overtime Datawatch added a lot of features to this ETL software, including the support for the broadest variety of data types and data sources simultaneously—including traditional structured relational databases, semi-structured sources like reports, PDF files, EDI streams, print spools and documents stored in files systems or enterprise content management systems, with a new mix of unstructured data such as machine data and social media stored in Big Data solutions or streaming directly from a host of real-time applications.
Datawatch Desktop does ETL from all above Data Sources and then extracts those data into Variety of Standard Formats: Excel spreadsheets, Access Databases, PDF reports, into Panopticon Workbooks etc. Simple example of how Monarch 11 does it you can see here:
The latest release of Monarch Professional is in version 12 and it has the new name as Datawatch Modeler; it also integrated and bundled together with Panopticon Desktop Designer under new name Datawatch Desktop and that bundle is available for $1895. As a result Datawatch created for itself an excellent up-sell opportunity: current customers on maintenance can trade-up to Datawatch Desktop for $366 (it also includes first year maintenance) - this is 5 times cheaper than Tableau Desktop professional. My understanding that maintenance of Datawatch Desktop is 22% per year of its price but you may get a better deal.
Datawatch Modeler v.12 has new Core engine with 16 External Lookups (was 9 in version 11), 512 Columns In Table (was 254), 100 Multi-Column Regions (was 40), Optimized for modelling large inputs Data Preview (work with first 100 records), has new PDF Engine, 10GB Internal Database size (was 2GB), Utilized 4 Cores for DB operations (was 2).
1st V for Big Data: Data Volume.
Math Strategies developed for Datawatch another tool - Monarch DataPump (recently renamed as Datawatch Automator or Datawatch Server - Automation Edition, currently in version 12). On 3/30/12 Datawatch acquired intellectual property for its underlying Monarch Report Analytics platform from Raymond Huger, d/b/a Math Strategies (Greensboro, NC).
Datawatch developed other editions of Datawatch Server:
Formerly Enterprise Server has new name now as Datawatch Server - Content Edition, version 12. Datawatch Server supports all Monarch functionality on server-side, integrates with web server(s) and related infrastructure, manages all users, their credentials, access rights, roles, privileges, user groups, manages and aggregates all content, data, data extracts etc.
Datawatch Server - Automation Edition (Data Pump) - automatically collects and refreshes all content, data and data extracts, both on-demand and on-schedule, manages all schedules etc.
Datawatch Server - Complete Edition includes Formerly Panopticon Server (manages all Data Visualizations and its users, converts Visualizations to web applications so they can be accessed through web browsers and HTML5 clients), Datawatch Enterprise Server and Data Pump.
Theoretically Datawatch Server (with help from Datawatch Automator) can support up to 524 Petabytes (1015 bytes) of Data which I consider a very Big Data for 2013.
3rd V for Big Data: High Velocity
Datawatch/Panopticon in-memory data engine supports data visualization for real-time business dashboards and it has low-latency display of analytics that are based on streaming data as it arrives. This enables Datawatch to handle the demanding continuous-intelligence applications, where quick responses are required. This is a big differentiator. An in-memory, OLAP-based StreamCube is associated with each graphical display object. The system processes new data as it arrives, selects the subset of important data, recalculates the relevant sections of the model and refreshes the associated parts of the display immediately. The parts of the model and the display that are not affected by the new data are not touched. This is faster and more efficient than conventional data visualization tools that operate on batch-loaded snapshots of data, run less frequently, and then recalculate the model and rebuild the display for each iteration.
Somebody I know was able to refresh and REPAINT 25000+ datapoints per second per one Datawatch/Panopticon Chart and this is much faster then any competitor.
Datawatch platform integrated with message-oriented middleware, including ActiveMQ, Qpid, Sonic MQ and Tibco EMS. It has connectors to Complex Event-Processing platforms (CEP), such as kx kdb+tick, OneTick CEP, Oracle CEP, StreamBase Systems' Event Processing Platform and Sybase Event Stream Processor. Datawatch also has interfaces for retrieving data from time series databases, conventional relational and columnar databases, files, Open Data Protocol (OData) sources and in-memory DBMSs. It can be customized for proprietary data sources (recent example is a Visualization Accelerator for Splunk) and even embedded within other applications. Like other leading data visualization tools, it supports a wide range of charts. It has a development studio (Desktop Designer) for designing and implementing dashboards, and HTML5-based clients/support for mobile applications.
4th and most desirable V: Data Visualization
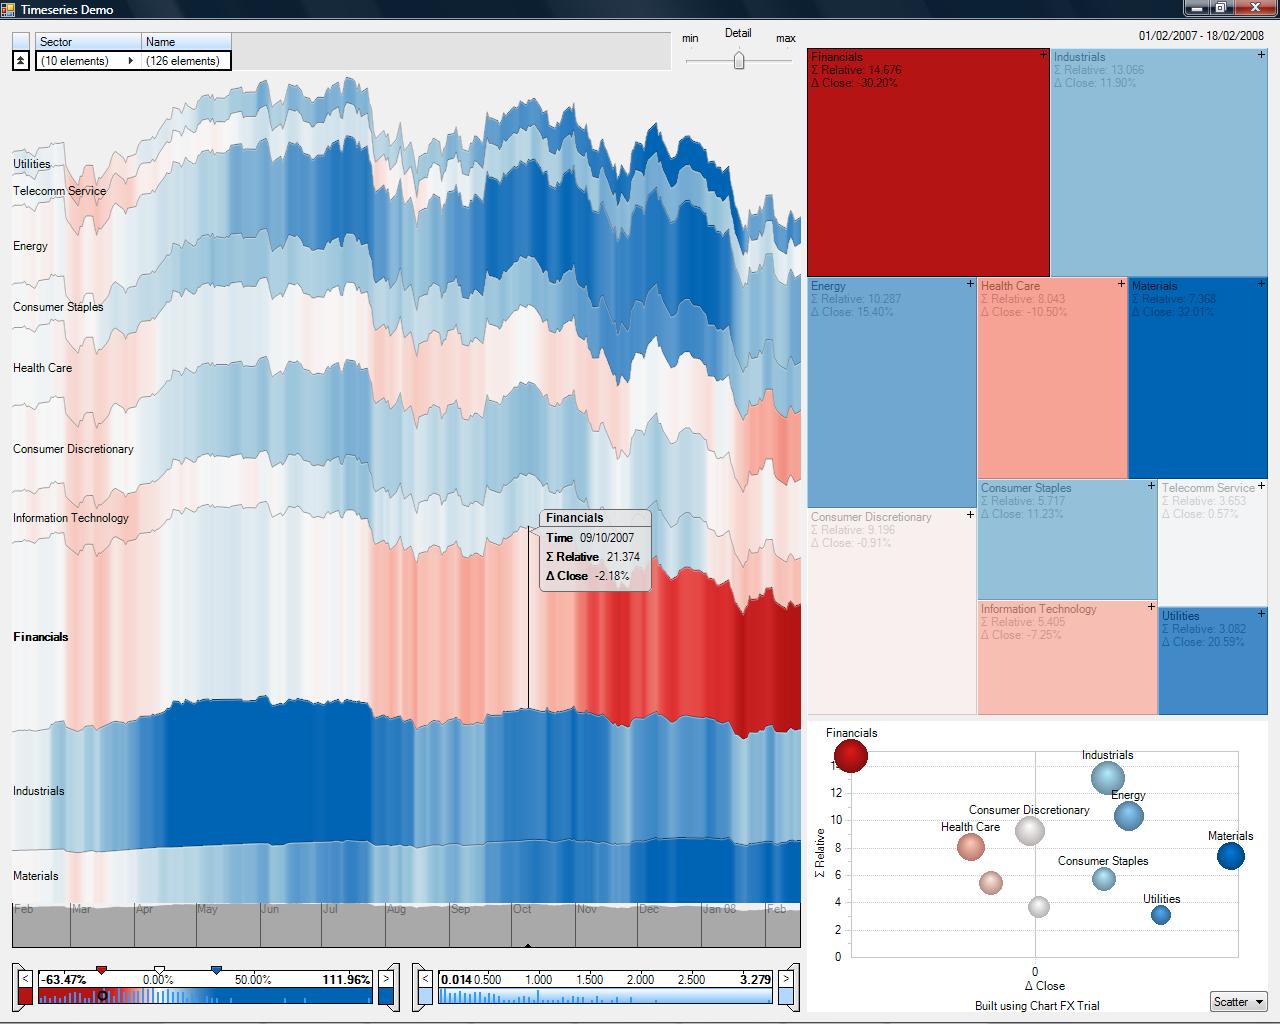
Datawatch is trying to get into Data Visualization (DV) field and it has potentials to be a 4th major Vendor here: it has a competitive DV Desktop, a competitive DV Server, an excellent HTML5 Client for it and set of differentiators like ready-to-use 3V triplet of features (see above) for Big Data and real-time DV. Datawatch Designer supports rich set of Graphs, Charts, Plots, Maps, Marks and other types of Visualizations, for example:
TIME SERIES Graphs: Candlestick, Horizon, Line, Needle, OHLC, Spread, Stack Area, Stacked / Grouped Needle, Table with Micro Charts, Sub Totals & Grand Totals, Timeseries Combo Charts, Timeseries Scatter Plot.
STATIC & TIME SLICE Graphs: Bullet, Heat Map, Heat Matrix, Horizontal/Vertical Bar, Horizontal/Vertical Dot Plot, Multi-Level Pie Chart, Numeric Line, Numeric Needle, Numeric Stacked Needles, Scatter Plot, Shapes / Choropleth, Surface Plot, Surface Plot 3D, Table with Micro Charts, Sub Totals & Grand Totals, Treemap.
In my humble opinion in order to compete with leading DV vendor like Tableau I think that Datawatch needs a few gradual changes, some of them I listed below:
Gradually on as-needed basis add features which other 3 DV Vendors have and Datawatch does not (it needs serious R&D)
Create free Datawatch Public (cloud service) to make people to learn and compare it (similar to Tableau Public) and to win mindshare
Create Fee-based Datawatch Online cloud service (similar to Tableau Online and Spotfire Cloud services)
Add more DV-oriented Partners (similar to Qlikview Partner Program, which has now 1500+ partners)
Create fee-based Data Visualization Practice in order to help large clients to implement DV Projects with Datawatch Desktop and Server.
Add support for Visual Analytics and Data Science, including integration with R Library (similar to Spotfire's S-Plus and TERR or at least the integration with R like Tableau 8.1 did today)
Add support for Storytelling, similar to what next versions of Tableau and Qlikview will have (soon) and communication abilities (similar to what Spotfire 6 has with TIBBR)
I may expand this list later as I see the fit, but Datawatch really has an unique opportunity here and large potential market!
Feedback 11/22/13 from multiple visitors of this blog:
I Quote the email from one of frequent visitors to my blog: "The fastest growing sales are in DV field (e.g. Panopticon revenue was 112% YoY in 2012). For example in 2006, when Qliktech's Sales were $44M, its YoY was 81%; 4 years later, in 2010, when Tableau had $40M revenue, YoY was 106%, see it here: http://www.prnewswire.com/news-releases/tableau-software-doubles-revenue-with-2010-landmark-year-114913924.html and 4 years later, in 2014 history can repeat itself again if Datawatch will allow to unbundle its DV Products and sell them separately. Instead, currently Datawatch prevents its own salesforce to sell separately own DV products like Panopticon Desktop Designer (you may call it now as Datawatch Visualization Studio) and Panopticon Server (you can call it now as Datawatch Visualization Server). That artificial limitation has to be removed!" visitor said to me over email... All I can say: it is not my call... Additional links:
Hello Andrei, Thanks for this analysis. In my view another major advantage for Datawatch is that they can allow for seamless auditing of viz data directly back to trusted reports, once the Monarch and Panopticon products have fully merged. I am sure that as more decisions are made based on vizzes, there will be more mistakes caused by poor data management and viz design, and the demand for auditable dashboards will increase. Best wishes, Olly http://blog.greenbar.info/

 Year-over-Year Growth for Trailing Twelve Month (YoY4ttm)[/caption]


Hello Andrei, Thanks for this analysis.
ReplyDeleteIn my view another major advantage for Datawatch is that they can allow for seamless auditing of viz data directly back to trusted reports, once the Monarch and Panopticon products have fully merged. I am sure that as more decisions are made based on vizzes, there will be more mistakes caused by poor data management and viz design, and the demand for auditable dashboards will increase.
Best wishes, Olly
http://blog.greenbar.info/