20140112

Motion Map Chart with Tableau

8 years ago Hans Rosling demoed on TED the Motion Chart, using Gapminder's Trendalizer. 7 years ago Google bought Trendalizer and incorporated into Google Charts.

A while ago, for my own education and for demo purposes, I implemented various Motion Charts using:

To implement Motion Chart in Tableau, you can use Page Shelf and place there either a Timing dimension (I used Dimension "Year" in Tableau example above) or even Measures Names (Average Monthly Home Value per ZIP Code) in my implementation of Motion Map Chart below.


AverageHomeValuePerZipCode

Tableau's ability to move through pages (automatically when Tableau Desktop or Tableau reader are in use and manually when Data Visualization hosted by Tableau Server and accessed through Web Browser) enabling us to create all kind of Motion Charts, as long as Visualization Author will put onto Pages a Time, Date or Timestamp variables, describing a Timeline. For me the most interesting was to make a Filled Map (Chart Type supported by Tableau, which is similar to Choropleth Map Charts) as a Motion Map Chart, see the result below.

As we all know, 80% of any Data Visualization are Data and I found the appropriate Dataset @Zillow Real Estate Research here: http://www.zillow.com/blog/research/data/ . Dataset contains Monthly Sales Data for All Homes (SFR, Condo/Co-op) for entire US from 1997 until Current Month (so far for 12604 ZIP Codes, which is only 25% of all USA ZIP codes) - average for each ZIP Code area.

This Dataset covers 197 Months and contains about 2.5 millions of DataPoints. All 5 Dimensions in Dataset are very "Geographical": State, County, Metro Area, City and ZIP code (to define the "Region" and enable Tableau to generate a Longitude and Latitude) and each record has 197 Measures - the Average Monthly Home Prices per Given Region (which is ZIP Code Area) for each available Month since 1997.

In order to create a Motion Filled Map Chart, I put Longitude as Column and Latitude as Row, Measure Values as Color, Measure Names (except Number of Records) as Pages, States and Measure Names as Filters and State and ZIP code as Details and finally Attribute Values of County, Metro Area and City as Tooltips. Result I published on Tableau Public here:

http://public.tableausoftware.com/views/zhv/ZillowHomeValueByZIP_1997-2013#1 ,

so you can review it online AND you can download it and use it within Tableau Reader or Tableau Desktop as the automated Motion Map Chart.

For Presentation and Demo purposes I created the Slides and Movie (while playing it don't forget to setup a Video Quality to HD resolution) with Filled Map Chart colored by Home Values for entire USA in 2013 as a Starting points and with 22 follow-up steps/slides: Zoom to Northeast Map, colored by 2013 Values, Zoom to SouthEastern New England 2013, start the Motion from Southeastern New England, colored  by 1997 Home Values per each ZIP Code and then automatic Motion through all years from 1997 to 2014, then Zoom to Eastern Massachusetts and finally Zoom to Middlesex County in Massachusetts, see movie below:


Here the content of this video as the "24 Online Slides with Screenshots from Motion Map Chart"

Now I think it is appropriate to express my New Year Wish (I repeating it for a few years in a row) that Tableau Software Inc. will port the ability to create AUTOMATED Motion Charts from Tableau Desktop and Tableau Reader to Tableau Server. Please!

20140105

More DV Readings from 2013

Data Visualization readings - last 4 months of 2013.


(time to read is shrinking...)

0. The Once and Future Prototyping Tool of Choice
http://tableaufriction.blogspot.com/2013/07/the-once-and-future-prototyping-tool-of.html

1. Block by Block, Brooklyn’s Past and Present
http://bklynr.com/block-by-block-brooklyns-past-and-present/

2. Data Visualization and the Blind
http://www.perceptualedge.com/blog/?p=1756

3. WHY ABRAHAM LINCOLN LOVED INFOGRAPHICS
http://www.newyorker.com/online/blogs/elements/2013/10/why-abraham-lincoln-loved-infographics.html#

4. Old Charts
[youtube=https://www.youtube.com/watch?v=r2q8kzdxbac]

5. Back To Basics
http://www.quickintelligence.co.uk/back-to-basics/

6. In-Memory Data Grid Key to TIBCO's Strategy
http://www.datanami.com/datanami/2013-10-21/in-memory_data_grid_key_to_tibco_s_strategy.html

7. Submarine Cable Map
http://visual.ly/submarine-cable-map?view=true

8. Interview with Nate Silver:
http://blogs.hbr.org/2013/09/nate-silver-on-finding-a-mentor-teaching-yourself-statistics-and-not-settling-in-your-career/

9. Qlikview.Next will be available in 2014
http://apandre.wordpress.com/2013/09/25/qlikview-next/

10. Importance of color?
http://www.qualia.hr/why-is-color-so-important-in-data-visualization/#

11. Qlikview.Next has a gift for Tableau and Datawatch
http://apandre.wordpress.com/2013/10/24/qlik-next-has-gift/

12. (October 2013) Tableau posts 90% revenue gain and tops 1,000 staffers, files for $450 million secondary offering
http://www.geekwire.com/2013/tableau-software/#

13. The Science Of A Great Subway Map
http://www.fastcodesign.com/3020708/evidence/the-science-of-a-great-subway-map

14. SEO Data Visualization with Tableau
http://www.blastam.com/blog/index.php/2013/10/how-to-create-awesome-seo-data-visualization-with-tableau/

15. John Tukey “Badmandments”
http://www.kdnuggets.com/2013/11/john-tukey-badmandments-lessons-from-great-statistician.html#
Tukey

Supplementary BADMANDMENTS:

  • 91. NEVER plan any analysis before seeing the DATA.

  • 92. DON'T consult with a statistician until after collecting your data.

  • 94. LARGE enough samples always tell the truth


16. Thinking about proper uses of data visualization.
http://data-visualization-software.com/finally-some-clear-thinking-about-proper-uses-of-data-visualization/

17. Big BI is Stuck: Illustrated by SAP BusinessObjects Explorer
http://www.perceptualedge.com/blog/?p=727

18. IBM (trying to catch up?) bets on big data visualization
http://www.zdnet.com/ibm-bets-on-big-data-visualization-7000022741/

19. Site features draft designs and full views of the Treemap Art project (By Ben Shneiderman)
http://treemapart.wordpress.com/
http://www.cs.umd.edu/hcil/treemap-history/
http://www.cs.umd.edu/hcil/treemap/
http://treemapart.wordpress.com/full-views/
http://treemapart.wordpress.com/category/draft-designs/
img_6560

20. A Guide to the Quality of Different Visualization Venues
http://eagereyes.org/blog/2013/a-guide-to-the-quality-of-different-visualization-venues

21. Short History of (Nothing) Data Science
http://www.forbes.com/sites/gilpress/2013/05/28/a-very-short-history-of-data-science/

22. Storytelling: Hans Rosling at Global Health - beyond 2015


23. DataWatch Quarterly Review: Rapid Growth Finally Materializing
http://seekingalpha.com/article/1872591-datawatch-quarterly-review-rapid-growth-finally-materializing

24. QlikView Extension – D3 Animated Scatter Chart
http://www.qlikblog.at/2574/qlikview-extension-animated-scatter-chart/

AnimatedScatterChart-500x328

25. SlopeGraph for QlikView (D3SlopeGraph QlikView Extension)
http://www.qlikblog.at/3093/slopegraph-for-qlikview-d3slopegraph-qlikview-extension/

26. Recipe for a Pareto Analysis
http://community.qlikview.com/blogs/qlikviewdesignblog/2013/12/09/pareto-analysis

27. Color has meaning
http://www.juiceanalytics.com/design-principles/color-has-meaning/#
Meaning-in-color-e1328906744180

28. TIBCO's Return To License Growth Frustratingly Inconsistent
http://seekingalpha.com/article/1909571-tibcos-return-to-license-growth-frustratingly-inconsistent

29. Automated Semantics and BI
http://www.forbes.com/sites/danwoods/2013/12/30/why-automated-semantics-will-solve-the-bi-dashboard-crisis/

30. What is wrong with definition of Data Science?
http://www.kdnuggets.com/2013/12/what-is-wrong-with-definition-data-science.html
mout-stats-cs-database

31. Scientific data became so complex, we have to Invent new Math to deal with it
http://www.wired.com/wiredscience/2013/10/topology-data-sets/

32. Samples


20140101

Selected Tableau Readings after TCC13

Selected Tableau Readings after TCC13 (since September 18, 2013)


sometimes reading is better then doing or writing...

0. Top 10 sessions from TCC13:
http://www.tableausoftware.com/about/blog/2013/12/top-10-sessions-tcc13-27292

1. Dual Color Axis:
https://www.interworks.com/blogs/wjones/2013/09/18/create-dual-color-axis-tableau

2. Evaluate models with fresh data using Tableau heat maps:
http://cooldata.wordpress.com/2012/07/12/evaluate-models-with-fresh-data-using-tableau-heat-maps/

3. Tableau Throws a Brick at Traditional BI:
http://www.datanami.com/datanami/2013-09-11/tableau_throws_a_brick_at_traditional_bi.html

4. Easy Empty Local Extracts:
http://www.tableausoftware.com/about/blog/2013/9/easy-empty-local-extracts-25152

5. Tableau 8.1: Sophisticated Analytics for Sophisticated People:
http://www.tableausoftware.com/about/blog/2013/9/tableau-81-sophisticated-analytics-sophisticated-people-25177

6. Tableau 8.1 and R (can be interesting for at least 5% of Tableau users):
http://www.tableausoftware.com/about/blog/2013/10/tableau-81-and-r-25327
also see:
https://www.interworks.com/blogs/trobeson/2013/11/27/using-r-tableau-81-getting-started
and here:
http://www.tableausoftware.com/about/blog/r-integration

7. Tableau, When Are You Going to Fix This?
http://www.datarevelations.com/tableau-when-are-you-going-to-fix-this.html

8. Automated PDF Email Distribution of Tableau Views Using PowerShell and Tabcmd:
http://www.interworks.com/blogs/tladd/2013/08/22/automated-pdf-email-distribution-tableau-views-using-powershell-and-tabcmd

9. Geocoding Addresses Directly in Tableau 8.1 Using Integration with R:
http://www.dataplusscience.com/Geocoding%20in%20Tableau%20using%20R.html

10. Best Practices for Designing Efficient Workbooks (and white Paper about it):
http://www.tableausoftware.com/about/blog/2013/10/best-practices-designing-efficient-workbooks-25391

11. Tableau Mapping Architecture:
http://urbanmapping.com/tableau/mapping-architecture.html

12. Story Points in Tableau 8.2 presentation mode:
http://eagereyes.org/blog/2013/story-points

13. Truly Global: Filtering Across Multiple Tableau Workbooks with the JavaScript API:
https://www.interworks.com/blogs/tladd/2013/10/24/truly-global-filtering-across-multiple-tableau-workbooks-javascript-api

14. Tableau 8.1 Worksheet, Dashboard menus improved, still room for more:
http://tableaufriction.blogspot.com/2013/10/tv81-beta-3-worksheet-dashboard-menus.html

15. Lollipops Charts in Tableau:
http://drawingwithnumbers.artisart.org/lollipops-for-quality-improvement/

16. Was Stephen Few Right?
http://www.datarevelations.com/was-stephen-few-right-my-problems-with-a-companys-iron-viz-competition.html

17. Precision Inputs Required In Addition To Analog Controls:
http://tableaufriction.blogspot.com/2013/11/precision-inputs-required-in-addition.html

18. Google Spreadsheets to Tableau connector - a working driver:
http://community.tableausoftware.com/thread/135281

19. Leveraging Color to Improve Your Data Visualization:
http://www.tableausoftware.com/public/blog/2013/10/leveraging-color-improve-your-data-visualization-2174

20. Workbook acts as a container for multiple Tableau-based Charts - 114
Samples and Visualization Types:
http://www.alansmitheepresents.org/2013/07/team-geiger-rides-again.html

21. The New Box-and-Whisker Plot:
http://www.tableausoftware.com/public/blog/2013/11/box-and-whisker-plots-2231

22. The Tableau Workbook Library:
http://www.tableausoftware.com/about/blog/2013/11/tableau-workbook-library-27004

23. Customizing Tableau Server Experience (Parts 1, 1.5, 2):
http://ugamarkj.blogspot.com/2013/11/customizing-tableau-server-experience.html
http://ugamarkj.blogspot.com/2013/12/customizing-tableau-server-experience.html
http://ugamarkj.blogspot.com/2013/12/customizing-tableau-server-experience_15.html

24. SAML Integration in Tableau 8.1:
https://www.interworks.com/blogs/daustin/2013/11/27/saml-integration-tableau-81

25. Tableau file types and extensions:
http://www.theinformationlab.co.uk/2013/12/02/tableau-file-types-and-extensions/

26. Tableau Server XML Information Files: The Master Class:
http://tableaulove.tumblr.com/post/69383091006/tableau-server-xml-information-files-the-master-class

27. Is it Transparency? Is it Opacity? Labeled one, works like the other:
http://tableaufriction.blogspot.com/2013/12/is-it-transparency-is-it-opacity.html

28. Viz Hall of Fame:
http://www.tableausoftware.com/about/blog/2013/12/viz-hall-fame-27270

29. Tableau Weekly Archive:
http://us7.campaign-archive1.com/home/?u=f3dd94f15b41de877be6b0d4b&id=d23712a896

30. 2013 Winners:
http://www.tableausoftware.com/public/blog/2013/12/2013-award-winners-2272
Happy New Year!
2014Cubes

20131224

Happy New 2014!

My Best Wishes for 2014 to all visitors of this Blog!


New2014

2013 was very successful year for Data Visualization (DV) community, Data Visualization vendors and for this Data Visualization Blog (number of visitors per grew from average 16000 to 25000+ per month).


From certain point of view 2013 was the year of Tableau - it went public, Tableau has now the largest Market Capitalization among DV Vendors (more than $4B as of Today) and its strategy (Data to the People!) became the most popular among DV users and it had (again) largest YoY revenue growth (almost 75% !) among DV Vendors. Tableau already employed more than 1100 people and still has 169+ job openings as of today. I wish Tableau to stay the Leader of our community and to keep their YoY above 50% - this will not be easy.


Qliktech is the largest DV Vendor and it will exceed in 2014 the half-billion dollars benchmark in revenue (probably closer to $600M by end of 2014) and will employ almost 2000 employees. Qlikview is one of the best DV product on market. I wish in 2014 Qlikview will create Cloud Services, similar to Tableau Online and Tableau Public and I wish Qlikview.Next will keep Qlikview Desktop Professional (in addition to HTML5 client).


I wish TIBCO will stop trying to improve BI or make it better - you cannot reanimate a dead horse; instead I wish Spotfire will embrace the approach "Data to the People" and act accordingly. For Spotfire my biggest wish is that TIBCO will spin it off the same way EMC did with VMWare. And yes, I wish Spofire Cloud Personal will be free and enabled to read at least local flat files and local DBs like Access.


2014 (or may be 2015?) can witness new, 4th DV player coming to competition: Datawatch bought recently Panopticon and if it will complete integration of all products correctly and add features which other DV vendors above already have (like Cloud Services), it can be very competitive player. I wish them luck!


TibxDataQlikQwchFrom051713To122413

Microsoft released in 2013 a lot of advanced and useful DV-related functionality and I wish (I recycling this wish for many years now) that Microsoft finally will package the most its Data Visualization Functionality in one DV product and add it to Office 20XX (like they did with Visio) and Office 365 instead of bunch of plug-ins to Excel and SharePoint.


It is a mystery for me why Panorama, Visokio and Advizor Solutions still relatively small players, despite all 3 of them having an excellent DV features and products. Based on 2013 IPO experience with Tableau may be the best way for them to go public and get new blood? I wish to them to learn from Tableau and Qlikview success and try this path in 2014-15...


For Microstrategy my wish is very simple - they are only traditional BI player who realised that BI is dead and they started in 2013 (actually before then 2013) a transition into DV market and I wish them all success they can handle!


I also think that a few thousands of Tableau, Qlikview and Spotfire customers (say 5% of customer base) will need (in 2014 and beyond) more deep Analytics and they will try to complement their Data Visualizations with Advanced Visualization technologies they can get from vendors like http://www.avs.com/


My best wishes to everyone! Happy New Year!


y16_84590563

20131214

Notes about Spotfire 6 Cloud pricing

2 months ago TIBCO (Symbol TIBX on NASDAQ) anounced Spotfire 6 at TUCON 2013 user conference. This as well a follow-up release  (around 12/7/13) of Spotfire Cloud supposed to be good for TIBX prices. Instead since then TIBX lost more then 8%, while NASDAQ as whole grew more then 5%:


TIBXvsNasdaqFrom1014To121313


For example, at TUCON 2013 TIBCO's CEO re-declared "5 primary forces for 21st century"(IMHO all 5 "drivers" sounds to me like obsolete IBM-ish Sales pitches) - I guess to underscore the relevance of TIBCO's strategy and products to 21st century:


  1. Explosion of data (sounds like Sun rises in the East);


  2. Rise of mobility (any kid with smartphone will say the same);


  3. Emergence of Platforms (not sure if this a good pitch, at least it was not clear from TIBCO's presentation);


  4. Emergence of Asian Economies (what else you expect? This is the side effect of the greedy offshoring for more then decade);


  5. Math trumping Science  (Mr. Ranadive and various other TUCON speakers kept repeating this mantra, showing that they think that statistics and "math" are the same thing and they do not know how valuable science can be. I personally think that recycling this pitch is dangerous for TIBCO sales and I suggest to replace this statement with something more appealing and more mature).


Somehow TUCON 2013 propaganda and introduction of new and more capable version 6 of Spotfire and Spotfire Cloud did not help TIBCO's stock. For example In trading on Thursday, 12/12/13 the shares of TIBCO Software, Inc. (NASD: TIBX) crossed below their 200 day moving average of $22.86, changing hands as low as $22.39 per share while Market Capitalization was oscillating around $3.9B, basically the same as the capitalization of 3 times smaller (in terms of employees) competitor Tableau Software.


As I said above, just a few days before this low TIBX price, on 12/7/13, as promised on TUCON 2013, TIBCO launched Spotfire Cloud and published licensing and pricing for it.


Most disappointing news is that in reality TIBCO withdrew itself from the competition for mindshare with Tableau Public (more then 100 millions of users, more then 40000 active publishers and Visualization Authors with Tableau Public Profile), because TIBCO no longer offers free annual evaluations. In addition, new Spotfire Cloud Personal service ($300/year, 100GB storage, 1 business author seat) became less useful under new license since its Desktop Client has limited connectivity to local data and can upload only local DXP files.


The 2nd Cloud option called Spotfire Cloud Work Group ($2000/year, 250GB storage, 1 business author/1 analyst/5 consumer seats) and gives to one author almost complete TIBCO Spotfire Analyst with ability to read 17 different types of local files (dxp, stdf, sbdf, sfs, xls, xlsx, xlsm, xlsb, csv, txt, mdb, mde, accdb, accde, sas7bdat,udl, log, shp), connectivity to standard Data Sources (ODBC, OleDb, Oracle, Microsoft SQL Server Compact Data Provider 4.0, .NET Data Provider for Teradata, ADS Composite Information Server Connection, Microsoft SQL Server (including Analysis Services), Teradata and TIBCO Spotfire Maps. It also enables author  to do predictive analytics, forecasting, and local R language scripting).


This 2nd Spotfire's Cloud option does not reduce Spotfire chances to compete with Tableau Online, which costs 4 times less ($500/year). However (thanks to 2 Blog Visitors - both with name Steve - for help), you cannot use Tableau online without licensed version of Tableau Desktop ($1999 perpetual non-expiring desktop license with 1st year maintenance included and each following year 20% $400 per year maintenance) and Online License (additional $500/year for access to the same site, but extra storage will not be added to that site!) for each consumer. Let's compare Spotfire Workgroup Edition and Tableau Online cumulative cost for 1, 2, 3 and 4 years for 1 developer/analyst and 5 consumer seats :


Cumulative cost for 1, 2, 3 and 4 years of usage/subscription, 1 developer/analyst and 5 consumer seats:


Year


Spotfire Cloud Work Group, 250GB storage


Tableau Online (with Desktop), 100GB storage


Cost Difference (negative if Spotfire cheaper)


1


$2000


$4999


-$2999


2


$4000


$8399


-$4399


3


$6000


$11799


-$5799


4


$8000


$15199


-$7199


UPDATE: You may need to consider some other properties, like available storage and number of users who can consume/review visualizations, published in cloud. In sample above:


  • Spotfire giving to Work Group total 250GB storage, while Tableau giving total 100GB to the site.

  • Spotfire costs less than Tableau Online for similar configuration (almost twice less!)


Overall, Spotfire giving more for your $$$ and as such can be a front-runner in Cloud Data Visualization race, considering that Qlikview does not have any comparable cloud options (yet) and Qliktech relying on its partners (I doubt it can be competitive) to offer Qlikview-based services in the cloud. Gere is the same table as above but as IMage (to make sure all web browsers can see it):


SFvsTBCloudPrice

3rd Spotfire's Cloud option called Spotfire Cloud Enterprise, it has customizable seating options and storage, more advanced visualization, security and scalability and connects to 40+ additional data sources. It requires an annoying negotiations with TIBCO sales, which may result to even larger pricing. Existence of 3rd Spotfire Cloud option decreases the value of its 2nd Cloud Option, because it saying to customer that Spotfire Cloud Work Group is not best and does not include many features. Opposite to that is Tableau's Cloud approach: you will get everything (with one exception: Multidimensional (cube) data sources are not supported by Tableau Online) with Tableau Online, which is only the option.


Update 12/20/13:  TIBCO announced results for last quarter, ending 11/30/13 with Quarterly revenue $315.5M (only 6.4% growth compare with the same Quarter of 2012) and $1070M Revenue for 12 months ended 11/30/13 (only 4.4% growth compare with the same period of 2012). Wall Street people do not like it today and TIBX lost today 10% of its value, with Share Price ending $22 and Market Capitalization went down to less then $3.6B. At the same time Tableau's Share Price went up $1 to $66 and Market Capitalization of Tableau Software (symbol DATA) went above $3.9B). As always I think it is relevant to compare the number of job openings today: Spotfire - 28, Tableau - 176, Qliktech - 71

20131207

DV footprints on Disk and in Memory, Part 2

My previous blogpost, comparing footprints of DV Leaders (Tableau 8.1, Qlikview 11.2, Spotfire 6) on disk (in terms of size of application file with embedded dataset with 1 million rows) and in Memory (calculated as RAM-difference between freshly-loaded (without data) application and  the same application when it will load appropriate application file (XLSX or DXP or QVW or TWBX) got a lot of feedback from DV Blog visitors. It even got mentioning/reference/quote from Tableau Weekly #9 here:


http://us7.campaign-archive1.com/?u=f3dd94f15b41de877be6b0d4b&id=26fd537d2d&e=5943cb836b and the full list of Tableau Weekly issues is here: http://us7.campaign-archive1.com/home/?u=f3dd94f15b41de877be6b0d4b&id=d23712a896

The majority of feedback asked to do a similar Benchmark - the footprint comparison for larger dataset, say with 10 millions of rows. I did that but it required more time and work,  because the footprint in memory for all 3 DV Leaders depends on the number of visualized Datapoints (Spotfire for years used the term Marks for Visible Datapoints and Tableau adopted these terminology too, so I used it from time to time as well, but I think that the correct term here will be "Visible Datapoints").


Basically I used the same dataset as in previous blogpost with main difference that I took subset with 10 millions of rows as a opposed to 1 Million rows in previous Benchmarks. The Diversity of used Dataset with 10 Million rows is here (each row has 15 fields as in previous benchmark):
[googleapps domain="docs" dir="spreadsheet/pub" query="key=0AuP4OpeAlZ3PdGFyUUl6VmdSWWVubk5sbjZ3Z256Znc&single=true&gid=3&output=html&widget=true" width="250" height="350" /]


I removed from benchmarks for 10 million rows the usage of Excel 2013 (Excel cannot handle more the 1,048,576 rows per worksheet) and PowerPivot 2013 (it is less relevant for given Benchmark). Here are the DV Footprints on disk and in Memory for Dataset with 10 Million rows and different number of Datapoints (or Marks: <16, 1000, around 10000, around 100000, around 800000):
[googleapps domain="docs" dir="spreadsheet/pub" query="key=0AuP4OpeAlZ3PdGFyUUl6VmdSWWVubk5sbjZ3Z256Znc&single=true&gid=4&output=html&widget=true" width="480" height=400" /]


Main observations and notes from benchmarking of footprints with 10 millions of rows as following:


  • Tableau 8.1 requires less (almost twice less) disk space for its application file .TWBX then Qlikview 11.2 (.QVW) for its application file (.QVW) or/and Spotfire 6 for its application file (.DXP).


  • Tableau 8.1 is much smarter when it uses RAM then Qlikview 11.2 and Spofire 6, because it takes advantage of number of Marks. For example for 10000 Visible Datapoints Tableau uses 13 times less RAM than Qlikview and Spotfire and for 100000 Visible Datapoints Tableau uses 8 times less RAM than Qlikview and Spotfire!


  • THe Usage of more than say 5000 Visible Datapoints (even say more than a few hundreds Marks) in particular Chart or Dashboard often the sign of bad design or poor understanding of the task at hand; the human eye (of end user) cannot comprehend too many Marks anyway, so what Tableau does (in terms of reducing the footprint in Memory when less Marks are used) is a good design.


  • For Tableau in results above I reported the total RAM used by 2 Tableau processes in memory TABLEAU.EXE itself and supplemental process TDSERVER64.EXE (this 2nd 64-bit process almost always uses about 21MB of RAM). Note: Russell Christopher also suggested to monitor TABPROTOSRV.EXE but I cannot find its traces and its usage of RAM during benchmarks.


  • Qlikview 11.2 and Spotfire 6 have similar footprints in Memory and on Disk.


20131203

DV footprints on Disk and in Memory, Part 1

More than 2 years ago I estimated the footprints for the sample dataset (428999 rows and 135 columns) when it encapsulated in text file, in compressed ZIP format, in Excel 2010, in PowerPivot 2010, Qlikview 10, Spofire 3.3 and Tableau 6. Since then everything upgraded to the "latest versions" and everything 64-bit now, including Tableau 8.1, Spotfire 5.5 (and 6), Qlikview 11.2, Excel 2013 and PowerPivot 2013.


I decided to use the new dataset with exactly 1000000 rows (1 million rows) and 15 columns with the following diversity of values (Distinct Counts for every Column below):


[googleapps domain="docs" dir="spreadsheet/pub" query="hl=en&hl=en&key=0AuP4OpeAlZ3PdGFyUUl6VmdSWWVubk5sbjZ3Z256Znc&single=true&gid=1&output=html&widget=true" width="240" height="360" /]

Then I put this dataset in every application and format mentioned above - both on disk and in memory. All results presented below for review of DV blog visitors:


[googleapps domain="docs" dir="spreadsheet/pub" query="hl=en&hl=en&key=0AuP4OpeAlZ3PdGFyUUl6VmdSWWVubk5sbjZ3Z256Znc&single=true&gid=0&output=html&widget=true" width="420" height="260" /]

Some comments about application specifics:


  • Excel and PowerPivot XLSX files are ZIP-compressed archives of bunch of XML files


  • Spotfire DXP is a ZIP archive of proprietary Spotfire text format


  • QVW  is Qlikview's proprietary Datastore-RAM-optimized format


  • TWBX is Tableau-specific ZIP archive containing its TDE (Tableau Data Extract) and TWB (XML format) data-less workbook


  • Footprint in memory I calculated as RAM-difference between freshly-loaded (without data) application and  the same application when it will load appropriate application file (XLSX or DXP or QVW or TWBX)


20131126

Happy Shopping for your Data Visualization Lab!

Since we approaching (in USA that is) a Thanksgiving Day for 2013 and shopping is not a sin for few days, multiple blog visitors asked me what hardware advise I can share for their Data Science and Visualization Lab(s). First of all I wish you will get a good Turkey for Thanksgiving (below is what I got last year):


Turkey2012

I cannot answer DV Lab questions individually - everybody has own needs, specifics and budget, but I can share my shopping thoughts about needs for Data Visualization Lab (DV Lab). I think DV Lab needs many different types of devices: smartphones, tablets, projector (at least 1), may be a couple of Large Touchscreen Monitors (or LED TVs connectable to PCs), multiple mobile workstations (depends on size of DV Lab team), at least one or two super-workstation/server(S) residing within DV Lab etc.


Smartphones and Tablets


I use Samsung Galaxy S4 as of now, but for DV Lab needs I will consider either Sony Xperia Z Ultra or Nokia 1520 with hope that Samsung Galaxy S5 will be released soon (and may be it will be the most appropriate for DV Lab):


sonyVSnokia

My preference for Tablet will be upcoming Google Nexus 10 (2013 or 2014 edition - it is not clear, because Google is very secritive about it) and in certain cases Google Nexus 7 (2013 edition). Until Nexus 10 ( next generation) will be released, I guess that two leading choices will be ASUS Transformer Pad TF701T


t701


and Samsung Galaxy Note 10.1 2014 edition (below is a relative comparison of the size of these 2 excellent tablets):


AsusVsNote10

Projectors, Monitors and may be Cameras.


Next piece of hardware in my mind is a projector with support for full HD resolution and large screens. I think there are many good choices here, but my preference will be BENQ W1080ST for $920 (please advise if you have a better projector in mind in the same price range):


benq_W1080ST

So far you cannot find too many Touchscreen Monitors for reasonable price, so may be these two 27" touchscreen monitors (DELL P2714T for $620 or Acer T272HL bmidz for $560) are good choices for now:


dell-p2714t-overview1

I also think that a good digital camera can help to Data Visualization Lab and considering something like this (can be bought for $300): Panasonic Lumix DMC FZ72 with 60X optical zoom and ability to do a Motion Picture Recording as HD Video in 1,920 x 1,080 pixels - for myself:


panasonic_lumix_dmc_fz72_08

Mobile and Stationary Workstations and Servers.


If you need to choose CPU, I suggest to start with Intel's Processor Feature Filter here: http://ark.intel.com/search/advanced . In terms of mobile workstations you can get quad-core notebook (like Dell 4700 for $2400 or Dell Precison 4800 or HP ZBook 15 for $3500) with 32 GB RAM and decent configuration with multiple ports, see sample here:


m4700

If you are OK with 16GB of RAM for your workstation, you may prefer Dell M3800 with excellent touchscreen monitor (3200x1800 resolution) and only 2 kg of weight. For a stationary workstation (or rather server) good choices are Dell Precision T7600 or T7610 or HP Z820 workstation. Either of these workstations (it will cost you!) can support up to 256GB RAM, up to 16 or even 24 cores in case of HP Z820), multiple high-capacity hard disks and SSD, excellent Video Controllers and multiple monitors (4 or even 6!) Here is an example of backplane for HP Z820 workstation:


HP-z820

I wish to visitors of this blog a Happy Holidays and good luck with their DV Lab Shopping!

20131119

Datawatch has 3 Vs, does Visualization now!

Datawatch published today its 2013 (ending 9/30/13) yearly and quarterly results and its YoY growth is impressive 16% (2013-over-2012), which is better then TIBCO (less then 13%) ! See Earnings Call Transcript here: http://seekingalpha.com/article/1849661-datawatch-corporations-ceo-discusses-q4-2013-results-earnings-call-transcript?part=single and webcast available here: http://www.investorcalendar.com/IC/CEPage.asp?ID=171788

Since Datawatch bought recently well-known swedish Data Visualization vendor Panopticon (which had 112% YoY in 2012!) for $31M in stock, Panopticon's sales for a first time added to Datawatch sales (at least $1.5M revenue per quarter), total Datawatch quarterly revenue (as expected) grew to almost $9M per quarter and to $30.3M per fiscal 2013 (ending 9/30/13).

You can compare "moving" Datawatch YoY index for last 6 quarters vs 2 Top DV Performers (Tableau above 70% YoY, Qlikview above 20%), vs similar (YoY-wise) DV Vendor (Spotfire about 12%) and finally vs 2 Traditional BI Vendors (Microstrategy and Actuate). The thickness of lines reflects Vendor's ttm (the revenue for Trailing Twelve Months) - click on Image to Enlarge:

[caption id="attachment_4647" align="aligncenter" width="510"]Year-over-Year Growth for Trailing Twelve Month (YoY4ttm) Year-over-Year Growth for Trailing Twelve Month (YoY4ttm)[/caption]

Datawatch founded in 1985(!), public (traded on NASDAQ as DWCH) since 1992; it has 44000+ customers (including 99 of Fortune 100) and 500000+ end users. Datawatch management team is experienced in BI space and includes veterans from IBM, Applix, Cognos etc. In last 3 years (since 10/1/10) DWCH shares increased in value more then 10 times:

ReturnIn3Years

2nd V for BigData: Data Variety.

The first version of main Datawatch software, called Monarch Professional was released in 1991 and developed by Math Strategies. Overtime Datawatch added a lot of features to this ETL software, including the support for the broadest variety of data types and data sources simultaneously—including traditional structured relational databases, semi-structured sources like reports, PDF files, EDI streams, print spools and documents stored in files systems or enterprise content management systems, with a  new mix of unstructured data such as machine data and social media stored in Big Data solutions or streaming directly from a host of real-time applications.

Datawatch Desktop does ETL from all above Data Sources and then extracts those data into Variety of Standard Formats: Excel spreadsheets, Access Databases, PDF reports, into Panopticon Workbooks etc. Simple example of how Monarch 11 does it you can see here:


or more professional and free video training you can find here: http://www.datawatch.com/information-optimization/item/196-guided-tour-monarch

The latest release of Monarch Professional is in version 12 and it has the new name as Datawatch Modeler; it also integrated and bundled together with Panopticon Desktop Designer under new name Datawatch Desktop and that bundle is available for $1895. As a result Datawatch created for itself an excellent up-sell opportunity: current customers on maintenance can trade-up to Datawatch Desktop for $366 (it also includes first year maintenance) - this is 5 times cheaper than Tableau Desktop professional. My understanding that maintenance of Datawatch Desktop is 22% per year of its price but you may get a better deal.

Monarch11

Datawatch Modeler v.12 has new Core engine with 16 External Lookups (was 9 in version 11), 512 Columns In Table (was 254), 100 Multi-Column Regions (was 40), Optimized for modelling large inputs Data Preview (work with first 100 records), has new PDF Engine, 10GB Internal Database size (was 2GB), Utilized 4 Cores for DB operations (was 2).

1st V for Big Data: Data Volume.

Math Strategies developed for Datawatch another tool - Monarch DataPump (recently renamed as Datawatch Automator or Datawatch Server - Automation Edition, currently in version 12). On 3/30/12 Datawatch acquired intellectual property for its underlying Monarch Report Analytics platform from Raymond Huger, d/b/a Math Strategies (Greensboro, NC).

Datawatch developed other editions of Datawatch Server:

  • Formerly Enterprise Server has new name now as Datawatch Server - Content Edition, version 12. Datawatch Server supports all Monarch functionality on server-side, integrates with web server(s) and related infrastructure, manages all users, their credentials, access rights, roles, privileges, user groups, manages and aggregates all content, data, data extracts etc.

  • Datawatch Server - Automation Edition (Data Pump) - automatically collects and refreshes all content, data and data extracts, both on-demand and on-schedule, manages all schedules etc.

  • Datawatch Server - Complete Edition includes Formerly Panopticon Server (manages all Data Visualizations and its users, converts Visualizations to web applications so they can be accessed through web browsers and HTML5 clients), Datawatch Enterprise Server and Data Pump.

V3

Theoretically Datawatch Server (with help from Datawatch Automator) can support up to 524 Petabytes (1015 bytes) of Data which I consider a very Big Data for 2013.

3rd V for Big Data: High Velocity

Datawatch/Panopticon in-memory data engine supports data visualization for real-time business dashboards and it has low-latency display of analytics that are based on streaming data as it arrives. This enables Datawatch to handle the demanding continuous-intelligence applications, where quick responses are required. This is a big differentiator. An in-memory, OLAP-based StreamCube is associated with each graphical display object. The system processes new data as it arrives, selects the subset of important data, recalculates the relevant sections of the model and refreshes the associated parts of the display immediately. The parts of the model and the display that are not affected by the new data are not touched. This is faster and more efficient than conventional data visualization tools that operate on batch-loaded snapshots of data, run less frequently, and then recalculate the model and rebuild the display for each iteration.

Somebody I know was able to refresh and REPAINT 25000+ datapoints per second per one Datawatch/Panopticon Chart and this is much faster then any competitor.

Datawatch platform integrated with message-oriented middleware, including ActiveMQ, Qpid, Sonic MQ and Tibco EMS. It has connectors to Complex Event-Processing platforms (CEP), such as kx kdb+tick, OneTick CEP, Oracle CEP, StreamBase Systems' Event Processing Platform and Sybase Event Stream Processor. Datawatch also has interfaces for retrieving data from time series databases, conventional relational and columnar databases, files, Open Data Protocol (OData) sources and in-memory DBMSs. It can be customized for proprietary data sources (recent example is a Visualization Accelerator for Splunk) and even embedded within other applications. Like other leading data visualization tools, it  supports a wide range of charts. It has a development studio (Desktop Designer) for designing and implementing dashboards, and HTML5-based clients/support for mobile applications.

4th and most desirable V: Data Visualization

Datawatch is trying to get into Data Visualization (DV) field and it has potentials to be a 4th major Vendor here: it has a competitive DV Desktop, a competitive DV Server, an excellent HTML5 Client for it and set of differentiators like ready-to-use 3V triplet of features (see above) for Big Data and real-time DV. Datawatch Designer supports rich set of Graphs, Charts, Plots, Maps, Marks and other types of Visualizations, for example:

  • TIME SERIES Graphs: Candlestick, Horizon, Line, Needle, OHLC, Spread, Stack Area, Stacked / Grouped Needle, Table with Micro Charts, Sub Totals & Grand Totals, Timeseries Combo Charts, Timeseries Scatter Plot.

  • STATIC & TIME SLICE Graphs: Bullet, Heat Map, Heat Matrix, Horizontal/Vertical Bar, Horizontal/Vertical Dot Plot, Multi-Level Pie Chart, Numeric Line, Numeric Needle, Numeric Stacked Needles, Scatter Plot, Shapes / Choropleth, Surface Plot, Surface Plot 3D, Table with Micro Charts, Sub Totals & Grand Totals, Treemap.

  • many Visualization Demos still available here: http://www.panopticon.com/Advanced-Data-Visualization and here: http://www.panopticon.com/demos

3232161725_e648f09137_o

In my humble opinion in order to compete with leading DV vendor like Tableau I think that Datawatch needs a few gradual changes, some of them I listed below:

  • Gradually on as-needed basis add features which other 3 DV Vendors have and Datawatch does not (it needs serious R&D)

  • Create free Datawatch Public (cloud service) to make people to learn and compare it (similar to Tableau Public) and to win mindshare

  • Create Fee-based Datawatch Online cloud service (similar to Tableau Online and Spotfire Cloud services)

  • Add more DV-oriented Partners (similar to Qlikview Partner Program, which has now 1500+ partners)

  • Create fee-based Data Visualization Practice in order to help large clients to implement DV Projects with Datawatch Desktop and Server.

  • Add support for Visual Analytics and Data Science, including integration with R Library (similar to Spotfire's S-Plus and TERR or at least the integration with R like Tableau 8.1 did today)

  • Add support for Storytelling, similar to what next versions of Tableau and Qlikview will have (soon) and communication abilities (similar to what Spotfire 6 has with TIBBR)

  • I may expand this list later as I see the fit, but Datawatch really has an unique opportunity here and large potential market!

Feedback 11/22/13 from multiple visitors of this blog:

I Quote the email from one of frequent visitors to my blog: "The fastest growing sales are in DV field (e.g. Panopticon revenue was 112% YoY in 2012). For example in 2006, when Qliktech's Sales were $44M, its YoY was 81%; 4 years later, in 2010, when Tableau had $40M revenue, YoY was 106%, see it here: http://www.prnewswire.com/news-releases/tableau-software-doubles-revenue-with-2010-landmark-year-114913924.html and 4 years later, in 2014 history can repeat itself again if Datawatch will allow to unbundle its DV Products and sell them separately. Instead, currently Datawatch prevents its own salesforce to sell separately own DV products like Panopticon Desktop Designer (you may call it now as Datawatch Visualization Studio) and Panopticon Server (you can call it now as Datawatch Visualization Server). That artificial limitation has to be removed!" visitor said to me over email... All I can say: it is not my call... Additional links: 

20131112

Data Vikings from Sweden, DV Motherland

In past Vikings discovered America, conquested or colonized parts of England, Russia, Ireland, Scotland, even Southern Italy and Iceland... But in 21st century (as far as this blog is concerned) Sweden became a Motherland of Data Visualization:


4SwedishDVVendorsLogosLet's start with most famous Data Viking and most known Storyteller in Data Visualization field - prof. Hans Rosling from Karolinska Institutet and chairman of the Gapminder Foundation (in Stockholm). Gapminder's team invented the popular and useful 6-dimensional Motion Chart and developed Trendalizer which was bought by Google in 2007, see it here: https://developers.google.com/chart/interactive/docs/gallery/motionchart . The recent example of Prof. Rosling Storytelling you can see  here:


[youtube ="https://www.youtube.com/watch?v=grZSxoLPqXI#!"]


In Stockholm you can find another Data Visualization Innovator - Panopticon is a leader in Complex Even Processing and real-time Visual Analytics. Among other innovation here is the example of Panopticon's invention (by its senior developer Hannes Reijner) of Horizon Chart, see sample here:


HorizonGraph

and short video about it here:


[youtube="https://www.youtube.com/watch?v=M53dYUcQbCs"]


In 2012 Panopticon posted 112% Year-Over-Year revenue growth (comparable with Tableau). In 2013 (the all stock deal closed by the end of September, 2013.) Datawatch bought Panopticon for $31.4M and I assume it will try to move some R&D from Sweden to Chelmsford, MA.


In  Göteborg/Gothenburg you can find R&D office of another DV Leader - Spotfire with 60+ Data Vikings. In 2007 TIBCO bought Spotfire for $195M but even now in 2013 unable to move R&D into USA. So now Spotfire actually has 3+ main offices: TIBCO Corporate Headquarters in California, Spotfire Headquarters in Somerville, MA (estimate is 15% of Spotfire workforce) and main R&D office in Sweden. In addition, lately TIBCO choose the strategy to buy rather then build new features, for example, just in 2013 they added to Spotfire portfolio the following new companies and as result they have even more distributed R&D team now:


  • Extended Results (PushBI) in Redmond, WA

  • MAPORAMA in Paris, France

  • StreamBase Systems, Inc. in Waltham, MA


As a result, despite the fact that Spotfire 6 is the most mature Data Visualization platform on market, people in TIBCO Corporate Headquarters running into risk of do not have enough knowledge of their own major Intellectual Properties.


In southern Sweden - Lund, we can find Swedish Headquarters of the major DV Leader - Qliktech, who occupied almost half of Data Visualization market in terms of sales. At least 140 Data Vikings located in Lund and may be another 200 elsewhere in Sweden. Qliktech's Data Vikings are major innovators with features like the fastest in-memory Data Engine, most natural Visual Drill-down, Associative Query Language to name a few. This also presents a major problem for Qliktech, because they have Headquarter in Radnor, PA (where only 150+ employees work (estimate), which is less then 10% of Qliktech's workforce!), Main marketing, sales and support office in Newton, MA (estimate: less then 5% of workforce) and most R&D in Lund (estimate: at least 10% of workforce).


This means that almost 500 technically advanced Data Visualization experts (engineers, developers, architects etc., which is at least 23% of total Qliktech+Spotfire workforce) are still in Sweden. The simple observation of Tableau's TCC13 conference in September 2013 shows that Tableau's top managers and officers know their product deeper and more intimately then their counterparts in Qliktech and Spotfire. That is very easy to explain: because 650+ Tableau's employees (almost 65% of their workforce and most developers, managers and officers) work in the same Main HQ office in Seattle, WA and they obviously talking to each other in-person and often!


My humble advice to Qliktech, Spotfire and Datawatch is simple - gradually relocate as much Data Vikings from Sweden to appropriate headquarters in USA or find and hire local american equivalents of those Swedish geniuses...


As a background for this advice, please consider this information (updated on 11/17/13): statistics of job openings clearly showing that all 3 DV Leaders keep doing (by inertia) what they did in past with only difference that it worked recently for Tableau and does not work for Qliktech and Spotfire. Here are specific examples:


  • Tableau has 176 job openings (much more then Qlikview (only 80) and Spotfire(only 18) combined)!


  • 97 (55%) of Tableau openings are in Seattle, more then half of Tableau’s openings are engineering and technical positions!


  • Qliktech has 17 (21%) positions opened in Lund, only 10 (12%) in Radnor and 4 (5%) in Newton, MA. Only 11 (14%, 9 times less then at Tableau in absolute numbers) Qliktech’s openings are engineering and technical.


  • Spotfire has only 18 openings (1 in Göteborg, 5 in CA, 4 in MA) and only 4 Spotfire’s positions (out of 18, 22% that is) are engineering or technical.


This statistics clearly showing that neither Qliktech no TIBCO see the wrong pattern and huge problem here and that can be a reason for disruption in the future and the gradual  relocation of Data Vikings is only way to prevent the danger… And of course, if you can afford, find and hire equal talents in USA Headquarters then by all means keep geniuses in Sweden without relocation which is a half-similar to what Tableau does (HALF is because Tableau historically does not need to maintain the significant R&D office outside of USA)!

20131103

Data Visualization Landscape changed: October 2013

Something dramatic happened during October 2013 with Data Visualization (DV) Market and I feel it everywhere. Share Prices for QLIK went down 40% from $35 to $25, for DATA went down 20% from $72 to below $60, for MSTR went up 27% from $100 to $127 and for DWCH went up  25% from $27.7 to $34.5. This blog got 30% more visitors then usual and it reached 26000 visitors per month of October 2013!
dwchPlus3DVPricesOctober2013So in this blog post I revisited who are actually the DV leaders and active players in Data Visualization field, what events and factors important here and I also will form the DVIndex containing 4-6 DV Leaders and will use it for future estimate of Marketshare and Mindshare in DV market.

In terms of candidates for DV Index I need measurable players, so I will prefer public companies, but will mention private corporations if they are relevant. I did some modeling and it turned out that the best indicator for DV Leader if its YoY (Year-over-Year Revenue growth) is larger than 10% - it will separate obsolete and traditional BI vendors and me-too attempts from real DV Leaders.

Let's start with traditional BI behemoths: SAP, IBM, Oracle and SAS: according to IDC, their BI revenue total $5810M, but none of those vendors had YoY (2012-over-2011) more then 6.7% ! These 4 BI Vendors literally desperate to get in to Data Visualization market (for example SAP Lumira, IBM is getting desperate too with Project Neo (will be in beta in early 2014), Rapidly Adaptive Visualization Engine (RAVE), SmartCloud Analytics-Predictive Insights, BLU Acceleration, InfoSphere Data Explorer or SAS Visual Analytics) but so far they were not competitive with 3 known DV Leaders (those 3 are part of DVIndex for sure) Qlikview, Tableau and Spotfire...
5th traditional BI Vendor - Microsoft had BI revenue in 2012 as $1044M, YoY 16% and added lately a lot of relevant features to its Data Visualization toolbox: Power Pivot 2013, Power View, Power Query, Power Map, SSAS 2012 (and soon SQL Server 2014) etc. Unfortunately Microsoft does not have Data Visualization Product but pushing everything toward Office 365, SharePoint and Excel 2013, which cannot compete in DV market...
6th Traditional BI vendor - Microstrategy made during October 2013 a desperate attempt to get into DV market by releasing 2 free Data Visualization products: Microstrategy Desktop and Microstrategy Express, which are forcing me to qualify Microstrategy for a status of DV Candidate, which I will include (at least temporary) into DVIndex.  Microstrategy BI revenue for TTM (Trailing 12 months) was $574, YoY is below 5% so while I can include it into DVIndex, I cannot say (yet?) that Microstrategy is DV Leader.

Datawatch Corporation is public (DWCH), recently bought advanced Data Visualization vendor - Panopticon for $31M. Panopticon TTM Revenue approximately $7M and YoY was phenomenal 112%  in 2012! Combining it with $27.5M TTM Revenue of Datawatch (45% YoY!) giving us approximately 55% YoY for combined company and qualifying DWCH as a new member of DVIndex!

Other potential candidates for DVIndex can be Panorama (and their Necto 3.0 Product), Visokio (they have very competitive DV Product, called Omniscope 2.8), Advizor Solution with their mature Advizor Visual Discovery 6.0 Platform), but unfortunately all 3 companies choose to be private and I have now way to measure their performance and so they will stay as DV Candidates only.

In order to monitor the progress of open source BI vendors toward DV Market, I also decided to include into DVIndex one potential DV Candidate (not a leader for sure) - Actuate with their BIRT product. Actuate TTM revenue about $138M and YoY about 3%. Here is the tabular MarketShare result with 6 members of DVIndex:

Please keep in mind that I have no way to get exact numbers for Spotfire, but I feel comfortable to estimate Spotfire approximately as 20% of TIBCO numbers. However, I feel Spotfire YoY is 16% which is higher then 11% TIBCO has. Numbers in table above are fluid and reflect the market situation by the end of October 2013. Also see my attempt to visualize the Market Share of 6 companies above in simple Bubble Chart (click on it to Enlarge; where * X-axis: Vendor's Revenue for last TTM: 12 trailing Months, * Y-axis: Number of Full-Time Employees, working for given Vendor, * Sized by Market Capitalization, in $B (Billions of Dollars), and * Colored by Year-Over-Year revenue Growth):

MarketShareIndex

MarketShare

For that date I also have an estimate of Mindshare of all 6 members of DVIndex by using the mentioning of those 6 companies by LinkedIn members, LinkedIn groups, posted on LinkedIn job openings and companies with Linkedin profile:
MindShareIndex
Again, please see below my attempt to represent Mindshare of those 6 companies above with simple Bubble Chart ((click on it to Enlarge; here 6 DV vendors, positioned relatively to their MINDSHARE on LinkedIn and where * X-axis: Number of LinkedIn members, mentioned Vendor in LinkedIn profile, * Y-axis: Number of LinkedIn Job Postings, with request of Vendor-related skills, * Sized by number of companies mentioned them on LinkedIn and * Colored by Year-Over-Year revenue Growth):

MindShare

Among other potential DV candidates I can mention some recent me-too attempts like Yellowfin, Domo, RoamBI, Zoomdata and similar companies (mostly private startups) and hardly commercial but very interesting toolkits like D3. None of them have impact on DV Market yet.
Now, let's review some of October events (may add more October events later):
2. Tableau Software Files Registration Statement for Proposed Secondary Offering. Also Tableau's Revenue in the three months ended in September rose to $61 million, 10 millions more then expected - Revenue jumped 90%! Tableau CEO Christian Chabot said the results were boosted by one customer that increased its contract with the company. "Our third quarter results were bolstered by a large multimillion-dollar deal with a leading technology company," he said. "Use of our products in this account started within one business unit and over the last two years have expanded to over 15 groups across the company. "Recently, this customer set our to establish an enterprise standard for self-service business intelligence, which led to the multimillion-dollar transaction. This deal demonstrates the power and value of Tableau to the enterprise." However DATA prices went down anyway in anticipation of a significant portion of these Shares Premium prices should quickly evaporate as the STOCK Options lock-up will expire in November 2013.

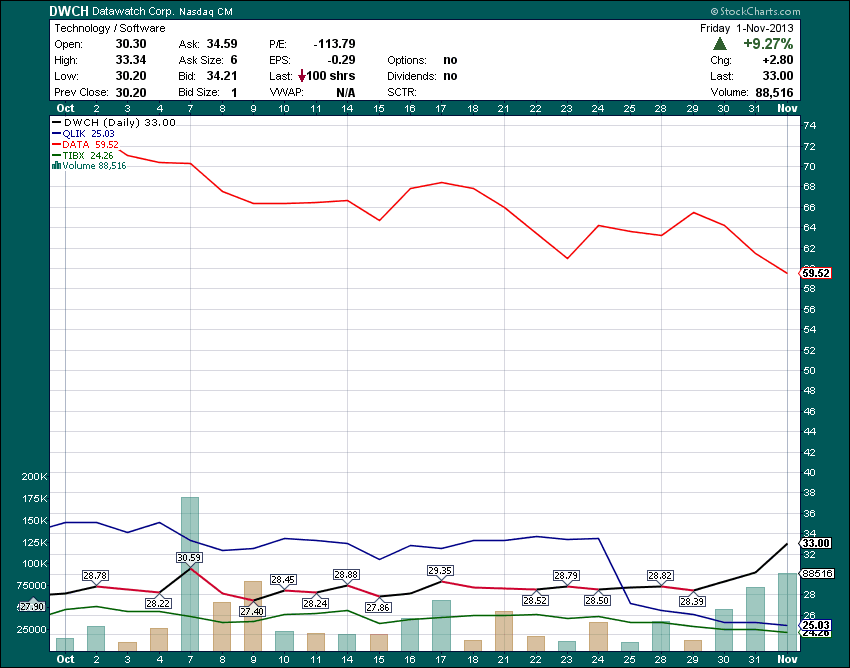
3. TIBCO TUCON 2013 conference somehow did not help TIBCO stock but in my mind brought attention to Datawatch and to the meteoric rise of DWCH stock (on Chart below compare it with QLIK and TIBX prices, which basically did not change during period of March-October of 2013) which is more then tripled in a matter of just 8 months (Datawatch bought and integrated Panopticon during exactly that period):
1. For the fourth quarter, Qliktech predicts earnings of 28 cents to 31 cents a share on revenue between $156 million and $161 million. The forecast came in significantly lower than analysts' expectations of 45 cents a share on $165.78 million in revenue. For the full year, the company projects revenue between $465 million and $470 million, and earnings between 23 and 26 cents a share. Analysts had expectations of 38 cents a share on $478.45 million. As far as I concern it is not a big deal, but traders/speculants on Wall Street drove QLIK prices down almost 40%
DWCHvsQLIKvsTIBXMar_Oct20134. Datawatch now has potentially better software stack then 3 DV Leaders, because of Datawatch Desktop is integrated with Panopticon Desktop Designer and Datawatch Server is integrated with Panopticon Data Visualization Server; it means that in addition to "traditional" BI + ETL + Big Data 3V features (Volume, Velocity, Variety) Datawatch has 4th V feature, which is relevant to DV Market: the advanced Data Visualization. Most visualization tools are unable to cope with the "Three V's of Big Data" – volume, velocity and variety. However, Datawatch's technology handles:
  • Data sources of any size (it has to be tested and compared with Qlikview, Spotfire and Tableau)
  • Data that is changing in real time (Spotfire has similar, but Qlikview and Tableau do not have it yet)
  • Data stored in multiple types of systems and formats
We have to wait and see how it will play out but competition from Datawatch will make Data Visualization market more interesting in 2014... I feel now I need to review Datawatch products in my next blog post...

20131024

Qlikview.Next has a gift for Tableau and Datawatch

Yesterday I got invited by Qliktech for their semi-annual New England QlikView Boston User Group meeting. It was so many participants, so Qliktech was forced to hold the Keynote (of course the presentation and the demo of Qlikview.Next) and 4 cool presentations by Customers and Partners (Ocean State Job Lot, Analog Devices, Cybex and Attivio) outside of its own office but in the same building  on the 1st floor @Riverside Offices in Newton, MA @Rebecca's Cafe.
It was plenty of very excited people in a very large room and very promising demo and presentation of Qlikview.Next, which actually will not be generally available until 2014. Entire presentation was done using new and capable HTML5 client, based on functionality Qliktech got when it bought NComVA 6 months ago.
I was alarmed when presenter never mentioned my beloved Qlikview Desktop and I when I asked directly about it, the answer shocked and surprised me. One of the most useful piece of software I ever used will not be part of Qlikview.Next anymore. As part of Qlikview 11.2, it will be supported for 3 years and then it will be out of the picture! I did not believe it and asked one more time during demo and 2 more times after presentation in-person during Networking and Cocktail Hour inside Qliktech offices. While food and drink were excellent, the answer on my question was the same - NO!

LeafsAndNeedlesOnGrass
I have the utmost respect for very smart software developers, architects and product managers of Qlikview, but in this particular case I have to invoke 20+ years of my own advanced and very extensive experience as the Software Architect, Coder and Software Director and nothing in my past can support such a decision. I do not see why Qlikview.Next can not have both (and we as Qlikview users need and love both) Qlikview Desktop Client and Qlikview HTML5 client?

I personally urge Qliktech (and I am sure the majority of 100000+ (according to Qliktech) Qlikview community will agree with me) to keep Qlikview Desktop client as long as Qlikview exist. And not just keep it but 1st,  keep it as the best Data Visualization Desktop Client on market and 2nd, keep it in sync (or better ahead) with HTML5 client.

In case if Qlikview Desktop will disappear from Qlikview.Next, it will be a huge gift to Tableau and Datawatch (and may be even Spotfire will benefit from it).

tableau_cmyk

Tableau recently invested heavily into progress of all variations of Tableau Desktop (Professional, Personal, Public, Online, Free Reader) including (finally) migration to 64-bit and even porting Desktop to MAC, so it will instantly get the huge advantage over Qlikview in desktop, workstation, development, design, debugging, testing, QA  and offline environments.

DATAWATCH CORPORATION LOGO


It will also almost immediately propel the Datawatch as a very attractive contender in Data Visualization market, because Datawatch got (when they bought Panopticon this year) the extremely capable Panopticon Desktop Designer

Panopticon_Data_Visualization_Software_logo_file,_800x155,_Real-Time_Visual_Data_Analysis


in addition to its own very relevant line of products.

Again, I hope I misunderstood answer I got 4 times during 4-hour meeting and during follow-up networking/cocktail hour or if understood it correctly, Qliktech will reconsider, but I will respect their decision if they don't...

So I have to disagree with Cindi Howson (as usual): even if "QlikTech Aims To Disrupt BI, Again", it actually will disrupt itself first, unless it will listen me begging them to keep Qlikview Desktop alive, well and ahead of competition.

SunsetOnCapeCod102413
You can find in Ted Cuzzillo's article here: http://datadoodle.com/2013/10/09/next-for-qlik/ the actual quote from Qliktech's CEO Lars Björk: "“We can disrupt the industry again”. My problem with this quote that Qliktech considers itself as the insider and reinventor of the dead and slow BI industry, while Tableau with its new motto "DATA to the people" is actually trying to be out of this grave and be inside own/new/fast growing Data Visualization space/field/market, see also blogpost from Tony Cosentino, VP of Ventana Research, here:
http://tonycosentino.ventanaresearch.com/2013/09/21/tableau-continues-its-visual-analytics-revolution/#!
You can see below interview with Time Beyers, who has own doubts about Qlikview.Next from investor's point of view:


Basically, Qlikview.Next is late for 2 years, it will not have Qlikview Desktop (big mistake), it still does not promise any Qlikview Cloud services similar to Tableau Online and Tableau Public and it still does not have server-less distribution of visualizations because it does not have free Qlikview Desktop Viewer/Readers similar to free Tableau Reader. So far it looks to me that QLIK may have a trouble in the future...

20131022

2 Free Microstrategy Visualization tools Disrupt it all!

Famous Traditional BI vendor got sick and tired to be out of Data Visualization market and decided to insert itself into it by force by releasing today 2 Free (for all users) Data Visualization Products:
  • MicroStrategy Analytics Desktop™ (Free self-service visual analytics tool)
  • MicroStrategy Analytics Express™ (Free Cloud-based self-service visual analytics)

    That looks to me as the huge Disruption of Data Visualization Market: For example similar Desktop Product from Tableau costs $1999 and Cloud Product called Tableau Online costs $500/year/user. It puts Tableau, Qlikview and Spotfire to a very tough position price-wise. However only Tableau stock went down almost $3 (more then %4) today, but MSTR, TIBX an QLIK basically did not react on Microstrategy announcement):


    DataMstrQlikTibx
    And don't think that only MIcrostrategy trying to get into DV market. For example SAP did similar (in less-dramatic and non-disruptive fashion) a few months ago with SAP Lumira (Personal Edition is free), also SAP Cloud and Standard edition available too, see it here http://www.saplumira.com/index.php and here http://store.businessobjects.com/store/bobjamer/en_US/Content/pbPage.sap-lumira . 

    SAP senior vice president and platform head Steve Lucas 10 weeks ago was asked if SAP would consider buying Tableau, Lucas went in the opposite direction. “We aren’t going to buy Tableau,” Lucas said with a smile on his face. There’s no need to buy an overvalued software company.” Rather, SAP wants to crush companies like Tableau (I doubt it is possible, but SAP is free to try) and build own Data Visualization product line out of Lumira, read more at
    http://venturebeat.com/2013/07/30/sap-platform-head-tableau-overvalued/#yFzUpzOh6ivMYvqP.99
    If I will be Tableau, Qlikview or Spotfire I will not worry yet about Microstrategy competition yet, because it is unclear how the future R&D for free Analytics Desktop and Express will be funded - out of MicroStrategy Analytics Enterprise™ R&D budget? That can be tricky, considering as of right now Tableau hiring hard (163 open job positions as of yesterday!) and Qliktech is very active too (about 93 openings as of yesterday) and even TIBCO has 36 open positions just for Spotfire alone.But I may start to worry about other DV Vendor - Datawatch, who recently completed the acquisition of Panopticon. Datawatch grew 45% YoY (2012-over-2011), has only 124 employees but $27.5M in sales, very experienced leadership, 40000+ customers worldwide and mature product line. May be another evidence of it here: http://online.wsj.com/article/PR-CO-20131023-907942.html

    New MicroStrategy Analytics Enterprise 9.4 includes data blending, which allows users to combine data from more than one source; the software stores the data in working memory without the need for a separate data integration product.  9.4 can connect with the MongoDB NoSQL data store as well as Hadoop distributions from Hortonworks, Intel and Pivotal. It comes with the R, adds better ESRI integration. The application can now fit 10 times as much data in memory as the previous version could, and the self-service querying now runs up to 40 percent faster.

    The three MicroStrategy Analytics Platform products also share a common user experience—making it easy to start small with self-service analytics and grow into the production-grade features of Enterprise. Desktop and Express from Microstrategy can be naturally extended (for fee)  to a new enterprise-grade BI&DV Suite, also released today and called MicroStrategy Analytics Enterprise™ (known under other name as MIcrostrategy Suite 9.4).

    MicroStrategy Analytics Enterprise™ Suite is also available starting today for free for developers and non-production use: 10 named user licenses of MicroStrategy Intelligence Server, MicroStrategy Web Reporter and Analyst, MicroStrategy Mobile, MicroStrategy Report Services, MicroStrategy Transaction Services, MicroStrategy OLAP Services, MicroStrategy Distribution Services, and MultiSource Option. 1 named user license of development software, MicroStrategy Web Professional, MicroStrategy Developer, and MicroStrategy Architect The server components have a 1 CPU limit).
    Quote from Wayne Eckerson, President of  BI Leader Consulting:
    "The new MicroStrategy Analytics Desktop makes MicroStrategy a top-tier competitor in the red-hot visual discovery market. The company was one of the first traditional enterprise BI vendors to ship a visual discovery tool, so its offering is mature compared to others in its peer group, but it was locked away inside its existing platform. By offering a stand-alone desktop visual discovery tool and making it freely available, MicroStrategy places itself among" Data Visualization Leaders.

    You also can read today's article from very frequent visitor to my blog (his name Akram), who is the Portfolio and Hedge Manager, Daily Trader and excellent investigator of all Data Visualization Stocks, DV Market and DV Vendors. His article "Tableau: The DV Market Just Got More Crowded"  can be found here (cannot resist to quote: "Microstrategy is priced like it has nothing to do with this space, and Tableau is priced like it will own the whole thing."):http://seekingalpha.com/article/1760432-tableau-the-dv-market-just-got-more-crowded?source=yahoo

    Heatmap generated by Microstrategy Analytic Desktop[caption id="attachment_4413" align="aligncenter" width="510"] Heatmap generated by Microstrategy Analytic Desktop[/caption]

    MicroStrategy Analytics Desktop.

    It's free visual analytics: Free Visual Insight, 100M per file, 1GB total storage, 1 of user, Free e-mail support for 30 days. Free access to online training, forum, and knowledge base, Data Sources: xls, csv, RDBMSes, Multidimensional Cubes, MapReduce, Columnar DBs, Access with Web Browser, export to Excel, PDF, flash and images, email distribution. The product is freely available to all and can be downloaded instantly at:http://www.microstrategy.com/free/desktop .

    TRellis of Bar Charts generated by Microstrategy Analytics Desktop[caption id="attachment_4415" align="aligncenter" width="510"] TRellis of Bar Charts generated by Microstrategy Analytics Desktop[/caption]
    http://www.microstrategy.com/Strategy/media/downloads/free/analytics-desktop_quick-start-guide.pdf Kevin Spurway, MicroStrategy’s vice president of industry and mobile marketing said: "The new desktop software was designed to compete with other increasingly popular self-serve, data-discovery desktop visualization tools offered by Tableau and others". To work with larger data sets, a user should have 2GB or more of working memory on the computer, Spurway said.

    MicroStrategy Analytics Express.

    MicroStrategy Analytics Express is a software-as-a-service (SaaS)-based application that delivers all the rapid-fire self-service analytical capabilities of Desktop, plus reports and dashboards, native mobile applications, and secure team-based collaboration – all instantly accessible in the Cloud. Today, the Express community includes over 32,000 users across the globe.

    In this release, Express inherits all the major functional upgrades of the MicroStrategy Analytics Platform, including new data blending features, improved performance, new map analytics, and much more. For a limited time, MicroStrategy is also making Express available to all users free for a year. With this valuable offer, users will be able to establish an account, invite tens, hundreds, or even thousands of colleagues to connect, analyze and share their data and insight, and do it all at no charge. For some organizations, the potential value of this offer can be $1 million or more. Users can sign up, access the service, and take advantage of this offer instantly at
    www.microstrategy.com/free/express
    MicroStrategy Analytics Express includes Free Visual Insight, Free web browser and iPad access, Free SaaS for one year, 1GB upload per file, unlimited number of users, Free e-mail support for 30 days. Free access to online training, forum, and knowledge base. Data Sources: xls, csv, RDBMSes Columnar DBs, Drobbox, Google Drive Connector, Visual Insight, a lot of security and a lot more, see http://www.microstrategy.com/Strategy/media/downloads/free/analytics-express_user-guide.pdf

    All tools from Microstrategy Analytics Platform (Desktop, Express and Entereprise Suite) support standard list of Chart Styles and Types:
    • Bar (Vertical/Horizontal Clustered/Stacked/100% Stacked),
    • Line (Vertical/Horizontal Absolute/Stacked/100% Stacked),
    • Combo Chart (of Bar and Area),
    • Area (Vertical/Horizontal Absolute/Stacked/100% Stacked)
    • Dual Axis ( Bar/Line/Area Vertical/Horizontal), 
    • HeatMap, 
    • Scatter, Scatter Grid, 
    • Bubble, Bubble Grid, 
    • Grid,
      Data Grid generated by Microstrategy Analytics Express

    • Pie, Ring, 
    • ESRI Maps, 
    Microstrategy Analytics Desktop and Express integrate and generate ESRI Map Visualizations
    • Network Visualization of Nodes, with lines representing links/connections/relationship,Network Graph Generated by Microstrategy Analytics Express


    e4Microcharts

    • Microcharts and Sparklines

    Data and Word Clouds, and of course any kind of interactive Dashboards as combination of all of the above Charts, Graphs, and Marks:
    Interactive Dashboard Generated by Microstrategy Analytics ExpressInteractive Dashboard Generated by Microstrategy Analytics Express