20121222

Happy New 2013!

My best wishes for 2013!


hny2013abp

2012 was extraordinary for Data Visualization community and I expect 2013 will be even more interesting than 2012. For Data Visualization vendors 2012 was unusual YEAR and surprised many people.


We can start with Qliktech, which grew only about 18% in 2012 (while in 2011 it was 42% and in 2010 it was 44%) and QLIK stock lost a lot... Spotfire on other hand grew faster then that and Tableau grew even faster than Spotfire. Tableau doubled its workforce and its sales now more than $100M per year. Together the sales of Qlikview, Spotfire and Tableau totaled to almost $600M in 2012 and I expect it may reach even $800M in  2013. All other vendors becoming less and less visible on market. While it is still possible to have a breakthrough from companies like Microsoft, Microstrategy, Visokio and Pagos, it is highly unlikely.


If you will search in web for wishes or wishlists for Qlikview or Tableau or Spotfire, you can find plenty of wishes, including even very technical. I will partially repeat myself, because some of my best wishes are still wishes and may be some of them will be never implemented. I will restrict myself to 3 best wishes per vendor.


Let me start with Spotfire, as the most mature product. I will use analogy: EMC did spin-off VMWare and (today) market capitalization of VMWare is close $40B, about 75% (!) of Market Capitalization of its parent company EMC! I wish that TIBCO will do the same to Spotfire as EMC did to VMWare. Compare with this wish all other wishes look minimal, like making Free Spotfire Desktop Reader (similar to what Tableau has) and make part of Spotfire Silver is completely Public and Free similar to ... Tableau Public.


For Qliktech I really wish them to stop bleeding capitalization-wise (did they lost $1B of MktCap during last 9 months?) and sales-wise (growing only 18% in 2012 compare with 42% in 2011). May be 2013 is good time for IBM to buy Qliktech? And yes, I wish Qlikview Server on Linux (I do not like new licensing terms of Windows 2012 Server) and I wish (for many years!) free Qlikview Desktop Viewer/Reader (similar ... to Tableau Reader) in 2013 to enable  server-less distribution of Qlikview-based Data Visualizations!


For Tableau I wish a very successful IPO in 2013 and I wish them to grow in 2013 as fast as they did in 2012! I really wish Tableau (and all its processes like VizQL, Application Server, Backgrounder etc.) to became 64-bit in 2013 and of course I wish Tableau Server on Linux (see my wish for Qlikview above).


hny2013blue

Since I still have my best wishes for Microsoft (I guess they will never listen me anyway), I wish them to stop in 2013 using the dead product (Silverlight) with Power View (just complete the switch to HTML5 already), to make it completely separate from SharePoint and make it equal part of Office (integrated with PowerPivot on Desktop) the same way as Visio and Access are parts of Office and as a result I wish Microsoft to have a Power View (Data Visualization) Server (integrated with SQL Server 2012 of course) as well.


[soundcloud url="http://api.soundcloud.com/tracks/29587286" iframe="true" /]

Also here are Flags of 21 countries from where this blog got most visitors in 2012:
21CountriesFromWhereDVBlogGotMostVistors

20121130

New Tableau 8 Server features

In my previous post http://apandre.wordpress.com/2012/11/16/new-tableau-8-desktop-features/ (this post is the continuation of it) , I said that Tableau 8 introduced 130+ new features, 3 times more then Tableau 7 did. Many of these new features are in Tableau 8 Server and this post about those new Server features (this is a repost from my Tableau blog: http://tableau7.wordpress.com/2012/11/30/new-tableau-8-server-features/ ).

The Admin and Server pages have been redesigned to show more info quicker. In list view the columns can be resized. In thumbnail view the grid dynamically resizes. You can hover over a thumbnail to see more info about visualization. The content search is better too:

ThumbnailView

Web authoring (even mobile) introduced by Tableau 8 Server. Change dimensions, measures, mark types, add filters, and use Show Me are all directly in a web browser and can be saved back to the server as a  new workbook or if individual permissions allow, to the original workbook:

webAuthoring

Subscribing to a workbook or worksheet will automatically notify about the dashboard or view updates to your email inbox. Subscriptions deliver image and link.

Tableau 8 Data Engine is more scalable now, it can be distributed between 2 nodes, 2nd instance of it now can be configured as Active, Synced and Available for reading if  Tableau Router decided to use it (in addition Fail-over function as before)server2sTableau 8 Server now supports Local Rendering, using graphic ability of local devices, modern browsers and HTML5. No-round-trip to server while rendering using latest versions of chrome 23+, Firefox 17+, Safari , IE 9+. Tableau 8 (both Server and Desktop, computing each view in Parallel. PDF files, generated by Tableau 8 up to 90% smaller and searchable. And Performance Recorder works on both Server and Desktop.

Tableau 8 Server introducing Shared sessions allows more concurrency, more caching. Tableau 7 uses 1 session per viewer. Tableau 8 using one session per many viewers, as long as they do no change state of filters and don't do other altering interaction. If interaction happened, Tableau 8 will clone the session for appropriate Interactor and apply his/her changes to new session:server3sIFinally Tableau getting API, 1st part of it I described in previous blog post about TDesktop - TDE API (C/C++, Python, Java on both Windows AND Linux!).

For Web Development Tableau has now brand new JavaScript API to customize selection, filtering, triggers to events, custom toolbar, etc. Tableau 8 has own JavaScript API WorkBench, which can be used right from you browser:server4w

TDE API allows to build own TDE on any machine with Python, C/C++ and Java (see 24:53 at http://www.tableausoftware.com/tcc12conf/videos/new-tableau-server-8 ). Additionally Server API (REST API) allows programmatically create/enable/suspend sites and add/remove users to sites.

In addition to Faster Uploads andPublishing Data Sources, users can Publish Filters as Set and User Filters. Data Sources can be Refreshed or Appended instead of republishing - all from Local Sources. Such Refreshes can scheduled using Windows Task Scheduler or other task scheduling software on client devices - this is a real TDE proliferation!

My wishlist for Tableau 8 Server: all Tableau Server processes needs to be 64-bit (and they still 32-bit, see it here: http://onlinehelp.tableausoftware.com/v7.0/server/en-us/processes.htm ; they are way overdue to be the 64-bit; Linux version of Tableau Server (Microsoft recently changed very unfavorably the way they charge users for each Client Access) is needed, I wish integration with R Library (Spotfire has it for years), I want Backgrounder Processes (mostly doing data extracts on server) will not consume core licenses etc…

And yes, I found in San Diego even more individuals who found the better way to spend their time compare with attending Tableau 2012 Customer Conference and I am not here to judge:

SealsInLaJolla

20121116

New Tableau 8 Desktop features

I left Tableau 2012 conference in San Diego (where Tableau 8 was announced) a while ago with enthusiasm which you can feel from this real-life picture of 11 excellent announcers:

Tableau8IntroducedInSanDiego

Conference was attended by 2200+ people and 600+ Tableau Software employees (Tableau almost doubled the number of employees in a year) and it felt like a great effort toward IPO (see also article here: http://www.bloomberg.com/news/2012-12-12/tableau-software-plans-ipo-to-drive-sales-expansion.html ).  See some video here: TCC12 Keynote . Tableau 8 introduce 130+ new features, 3 times more then Tableau 7 did. Almost half of these new features are in Tableau 8 Desktop and this post about those new Desktop features (this is a repost from my Tableau Blog: http://tableau7.wordpress.com/2012/11/16/new-tableau-8-desktop-features/). New Tableau 8 Server features deserved a separate blog post which I will publish a little later after playing with Beta 1 and may be Beta 2.

A few days after conference the Tableau 8 Beta Program started with 2000+ participants. One of the most promising features is new rendering engine and I build special Tableau 7 visualization (and its port to Tableau 8) with 42000 datapoints: http://public.tableausoftware.com/views/Zips_0/Intro?:embed=y  to compare the speed of rendering between versions 7 and 8:

ZipColors

Among new features are new (for Tableau) visualization types: Heatmap, "Packed" Bubble Chart and Word Cloud, and I build simple Tableau 8 Dashboard to test it (all 3 are visualizing the 3-dimensional set where 1 dimension used as list of items, 1 measure used for size and 2nd measure used for color of items):

3NewTypesOfVisualizationsInTableau

List of new features includes improved Sets (comparing members vs. non-members, adding/removing members, combining Sets: all-in-both, shared-by-both, left-except-right, right-except-left), Custom SQL with parameters, Freeform Dashboards (I still prefer MDI UI where each Chart/View Sheet has own Child Window as oppose to Pane), ability to add multiple fields to Labels, optimized label placement, built-in statistical models for visual Forecasting, Visual Grouping based on your data selection, Redesigned Mark Card (for Color, Size, Label, Detail and Tooltip Shelves).

New Data features include data blending without mandatory linked field in a view and with ability to filter data in secondary data sources; refreshing server-based Data Extracts can be done from local data sources; Data Filters (in addition be either local or global) can be shared now among selected set of worksheets and dashboards. Refresh of Data Extract can be done using command prompt for Tableau Desktop, for example

>tableau.exe refreshremoteextract

Tableau 8 has (finally) API (C/C++, Python, Java) to directly create a Tableau Data Extract (TDE) file, see example here: http://ryrobes.com/python/building-tableau-data-extract-files-with-python-in-tableau-8-sample-usage/

Tableau 8 (both Desktop and Server) can then connect to this extract file natively! Tableau provides new native connection for Google Analytics and Saleforce.com. TDE files now much smaller (especially with text values) - up to 40% smaller compare with Tableau 7.

Tableau 8 has performance enhancements, such as the new ability to use hardware accelerators (of modern graphics cards), computing views within dashboard in parallel (in Tableau 7 it was consecutive computations) and new  performance recorder allows to estimate and tune a workload of various activities and functions and optimize the behavior of workbook.

I still have a wishlist of features which are not implemented in Tableau and I hope some them will be implemented later: all Tableau processes are 32-bit (except 64-bit version of data engine for server running on 64-bit OS) and they are way overdue to be the 64-bit; many users demand MAC version of Tableau Desktop and Linux version of Tableau Server (Microsoft recently changed very unfavorably the way they charge users for each Client Access), I wish MDI UI for Dashboards where each view of each worksheet has own Window as oppose to own pane (Qlikview does it from the beginning of the time), I wish integration with R Library (Spotfire has it for years), scripting languages and IDE (preferably Visual Studio), I want Backgrounder Processes (mostly doing data extracts on server) will not consume core licenses etc...

Despite the great success of the conference, I found somebody in San Diego who did not pay attention to it (outside was 88F, sunny and beautiful):

HummingbirdInLaJolla

20121027

Google+ extension of this blog: 4277+ followers

On May 3rd of 2012 the Google+ extension http://tinyurl.com/VisibleData of this Data Visualization blog reached 500+ followers, on July 9 it got 1000+ users, on October 11 it had already 2000+ users, 11/27/12 my G+ Data Visualization Page has 2190+ followers and still growing every day (updated as of 12/01/12: 2500+ followers.


One of reasons of course is just a popularity of Data Visualization related topics and other reason covered in interesting article here:


http://www.computerworld.com/s/article/9232329/Why_I_blog_on_Google_And_how_ .

In any case, it helped me to create a reading list for myself and other people, base on feedback I got. According to CicleCount, as of 11/13/12 update, my Data Visualization Google+ Page ranked as #178 most popular page in USA. Thank you G+ !


Update 5/25/13: G+ extension of this blog now has 3873+ followers and as of  7/15/13 as of 4277+ followers):


DVFollowersOnGPlus071513


20121018

Qlikview can go outside RAM, finally

Qlikview 10 was released around 10/10/10, Qlikview 11 - around 11/11/11, so I expected Qlikview 12 to be released on 12/12/12 but "instead" we are getting Qlikview 11.2 with Direct Discovery in December 2012, which supposedly provides a "hybrid approach so business users can get the QlikView associative experience even with data that is not stored in memory"


This feature demanded by users (me included) for a long time, but I think noise around so called Big Data and competition forced Qliktech to do it. Spotfire has it for a longtime (as well as 64-bit implementation) and Tableau has something like that for a while (unfortunately Tableau still 32-bit) . You can test Beta of it, if you have time: http://community.qlikview.com/blogs/technicalbulletin/2012/10/22/qlikview-direct-discovery-beta-registration-is-open


Just 8 months ago Qliktech estimated its sales for 2012 as $410M and suddenly 3 months ago it changed its estimates down to $381M, just 19% over 2011, which is in huge contrast with Qliktech's previous speed of growth and way behind the current speed of growth of Tableau and even less then current speed of growth of Spotfire. During last 2 years QLIK stock unable to grow significantly:


and all of the above forcing Qliktech to do something outside of gradual improvements - new and exciting functionality needed and Direct Discovery may help!


QlikView Direct Discovery enables users to perform visual analysis against "any amount of data, regardless of size". With the introduction of this unique hybrid approach, users can associate data stored within big data sources directly alongside additional data sources stored within the QlikView in-memory model. QlikView can "seamlessly connect to multiple data sources together within the same interface", e.g. Teradata to SAP to Facebook allowing the business user to associate data across the data silos. Data outside of RAM can be joined with the in-memory data with the common field names. This allows the user associatively navigate both on the direct discovery and in memory data sets.


QlikView developer should setup the Direct Discovery table on the QlikView application load script to allow the business users to query the desired big data source. Within the script editor a new syntax is introduced to connect to data in direct discovery form. Traditionally the following syntax is required to load data from a database table:


To invoke the direct discovery method, the keyword “SQL” is replaced with “DIRECT”.


In the example above only column CarrierTrackingNumber and ProductID are loaded into QlikView in the traditional manner, other columns exist in the data table within the Database including columns OrderQty and Price. OrderQty and Price fields are referred as “IMPLICIT” fields. An implicit field is a field that QlikView is aware of on a “meta level”. The actual data of an implicit field resides only in the database but the field may be used in QlikView expressions. Looking at the table view and data model of the direct discovery columns are not within the model (on the OrderFact table):


Once the direct discovery structure is established, the direct discovery data can be joined with the in-memory data with the common field names (Figure 3). In this example, “ProductDescription” table is loaded in-memory and joined to direct discovery data with the ProductID field. This allows the user to associatively navigate both on the "direct discovery" and in memory data sets.


Direct Discovery will be much slow then in-memory processing and this is is expected, but it will take away from Qlikview its usual claim that is is faster then competitors. QlikView Direct Discovery can only be used against SQL compliant data sources. The following data sources are supported;


• ODBC/OLEDB data sources - All ODBC/OLEDB sources are supported, including SQL Server, Teradata and Oracle.
• Custom connectors which support SQL – Salesforce.com, SAP SQL Connector, Custom QVX connectors for SQL compliant data stores.


Due to the interactive and SQL syntax specific nature of the Direct Discovery approaches a number of limitations exist. The following chart types are not supported;
• Pivot tables
• Mini charts
And the following QlikView features are not supported:
• Advanced aggregation
• Calculated dimensions
• Comparative Analysis (Alternate State) on the QlikView objects that use Direct
Discovery fields
• Direct Discovery fields are not supported on Global Search
• Binary load from a QlikView application with Direct Discovery table


Here is a some preliminary video about Direct Discovery, published by Qliktech:


It was interesting to me that just 2 days after Qliktech pre-anounced Direct Discovery it also partners with Teradata. Tableau partners with Teradata for a while and Spotfire did it a month ago, so I guess Qliktech trying to catchup in this regard as well. I mentioned it only to underscore the point of this blog post: Qliktech realized that it behind its competitors in some areas and it has to follow ASAP.

20120925

Spotfire 5 is announced

Today TIBCO announced Spotfire 5, which will be released in November 2012. Two biggest news are the access to SQL Server Analysis Services cubes and the integration with Teradata "by pushing all aggregations, filtering and complex calculations used for interactive visualization into the (Teradata) database".


Spotfire team "rewrote" its in-memory engine for v. 5.0 to take advantage of high-capacity, multi-core servers. “Spotfire 5 is capable of handling in-memory data volumes orders of magnitude greater than the previous version of the Spotfire analytics platform” said Lars Bauerle, vice president of product strategy at TIBCO Spotfire.


Another addition is "in-database analysis" which allows to apply analytics within the database platforms (such as Oracle, Microsoft SQL Server and Teradata) without  extracting and moving data, while handling analyses on Spotfire server and returning result sets back to the database platform.


Spotfire added new Tibco Enterprise Runtime for R, which embeds R runtime engine into the Spotfire statistical server. TIBCO claims that Spotfire 5.0 scales to tens of thousands of users! Spotfire 5 is designed to leverage the full family of TIBCO business optimization and big data solutions, including TIBCO LogLogic®, TIBCO Silver Fabric, TIBCO Silver® Mobile, TIBCOBusinessEvents®, tibbr® and TIBCO ActiveSpaces®.

20120920

Data Visualization Seminar at MassTLC 9/20/12

The Mass Technology Leadership Council (MassTLC) organized today the Data Visualization Panel in their series of "Big Data Seminars":


http://www.masstlc.org/events/event_details.asp?id=243502


and they invited me to be a Speaker and Panelist together with Irene Greif (Fellow @IBM) and Martin Leach (CIO @Broad Institute). Most interesting about this event was that it was sold out and about 150 people came to participate, even it was most productive time of the day (from 8:30am until 10:30am). Compare with what I observed just a few years ago, I sensed the huge interest to Data Visualization, base on multiple, very interesting and relevant questions I got from event participants.

20120812

Power View in Excel 2013

I doubt that Microsoft is paying attention to my blog, but recently they declared that Power View now has 2 versions: one  for SharePoint (thanks, but no thanks) and one for Excel 2013. In other words, Microsoft decided to have own Desktop Visualization tool. In combination with PowerPivot and SQL Server 2012 it can be attractive for some Microsoft-oriented users but I doubt it can compete with Data Visualization Leaders - too late.


Most interesting is the note about Power View 2013 on Microsoft site: "Power View reports in SharePoint are RDLX files. In Excel, Power View sheets are part of an Excel XLSX workbook. You can’t open a Power View RDLX file in Excel, and vice versa. You also can’t copy charts or other visualizations from the RDLX file into the Excel workbook."


But most amazing is that Microsoft decided to use the dead Silverlight for Powerview: "Both versions of Power View need Silverlight installed on the machine." And we know that Microsoft switched to HTML5 from Silverlight and no new development planned for Silverlight! Good luck with that...


And yes, you can add now maps (Bing of course), see it here:


20120708

LinkedIn Stats about Data Visualization tools

I used LinkedIn for years to measure of how many people mentioning Data Visualization tools on their profiles, of how many LinkedIn groups dedicated to those DV tools and what group membership is. Recently these statistics show dramatic changes in favor of Qlikview and Tableau as undisputed leaders in people's opinions.


Here is how many people mentioned specific tools (statistics were updated on 9/4/12 and numbers changing every day) on their profiles:


  • Tableau - 18584,

  • Qlikview  - 17471,

  • Spotfire - 3829,

  • SAS+JMP - 3443,

  • PowerPivot - 2335


Sample of "People" search URL: http://www.linkedin.com/search/fpsearch?type=people&keywords=Tableau or http://www.linkedin.com/search/fpsearch?type=people&keywords=SAS+JMP


Here is how many groups dedicated to [in brackets a "pessimistic" estimate of total non-overlapping membership]:


  • Qlikview - 169 [13000+],

  • Tableau - 76 [6000+],

  • Spotfire - 29 [2000+],

  • SAS (+AND+) JMP - 23 [2000+],

  • PowerPivot - 16 [2000+]


Sample of "Group" search URL: http://www.linkedin.com/search-fe/group_search?pplSearchOrigin=GLHD&keywords=Qlikview

20120622

Advizor Analyst vs. Tableau or Qlikview...

I feel guilty for many months now: I literally do not have time for project I wish to do for a while: to compare Advizor Analyst and other Visual Discovery products from Advizor Solutions, Inc. with leading Data Visualization products like Tableau or Qlikview. I am asking visitors of my blog to volunteer and be a guest blogger here; the only pre-condition here is: a guest blogger must be the Expert in Advizor Solutions products and equally so in on of these 3: Tableau, Qlikview or Spotfire.

ADVIZOR's Visual Discovery™ software is built upon strong data visualization technology spun out of a research heritage at Bell Labs that spans nearly two decades and produced over 20 patents. Formed in 2003, ADVIZOR has succeeded in combining its world-leading data visualization and in-memory-data-management expertise with predictive analytics to produce an easy to use, point and click product suite for business analysis.

Advizor has many Samples, Demos and Videos on its site: http://www.advizorsolutions.com/gallery/ and some web Demos, like this one

http://webnav.advizorsolutions.net/adv/Projects/demo/MutualFunds.aspx but you will need the Silverlight plugin for your web browser installed.

If you think that Advizor can compete with Data Visualization leaders and you have interesting comparison of it, please send it to me as MS-Word article and I will publish it here as a guest blog post. Thank you in advance...

20120609

Tableau as the front-end for Big Data

(this is a repost from my other blog: http://tableau7.wordpress.com/2012/06/09/tableau-and-big-data/ )

Big Data can be useless without multi-layer data aggregations, hierarchical or cube-like intermediary Data Structures, when ONLY a few dozens, hundreds or thousands data-points exposed visually and dynamically every single viewing moment to analytical eyes for interactive drill-down-or-up hunting for business value(s) and actionable datum (or "datums" - if plural means data). One of best expression of this concept (at least how I interpreted it) I heard from my new colleague who flatly said:


“Move the function to the data!"


I got recently involved with multiple projects using large data-sets for Tableau-based Data Visualizations (100+ millions of rows and even Billions of records!). Some of largest examples of their sizes I used were: 800+ millions of records and other was 2+ billions of rows.


So this blog post is to express my thoughts about such Big Data (in average examples above have about 1+ KB per CSV record before compression and other advanced DB tricks, like columnar Databases used by Data Engine of Tableau) as back-end for Tableau. But please keep in mind that as a 32-bit tool, Tableau itself is not ready for Big Data. In addition, I think Big Data is mostly a buzzword and BS and we are  forced by marketing BS masters to use sometimes this stupid term.


Here are some Factors involved into Data Delivery from main and designated Database (Back-ends like Teradata, DB2, SQL Server or Oracle) for Tableau-based Big Data Visualizations) into “local” Tableau Visualizations (many people still trying to use Tableau as a Reporting tool as oppose to (Visual) Analytical Tool:


  • Queuing thousands of Queries to Database Server. There is no guarantee your Tableau query will be executed immediately; in fact it WILL be delayed.


  • Speed of Tableau Query when it will start to be executed depends on sharing CPU cycles, RAM and other resources with other queries executed SIMULTANEOSLY with your query.


  • Buffers, pools and other resources available for particular user(s) and queries at your Database Server are different and depends on privileges and settings given to you as a Database User


  • Network speed: between some servers it can be 10Gbits (or even more), in most cases it is 1Gbit inside server rooms, outside of server rooms I observed in many old buildings (over wired Ethernet) max 100Mbits coming into user’s PC; in case if you using Wi-Fi it can be even less (say 54 Mbits?). If you are using internet it can be even less (I observed speed in some remote offices as 1 Mbit or so over old T-1 lines); if you using VPN it will max out at 4Mbits or less (I observed it in my home office).


  • Utilization of network. I use Remote Desktop Protocol - RDP to VM (from my workstation or notebook; (VM or VDI Virtual Machine, sitting in server room) and connected to servers with network speed of 1Gbit, but it still using maximum 3% of network speed (about 30 MBits, which is about 3 Megabytes of data per second, which is probably about few thousands of records per seconds.


That means that network may have a problem to deliver 100 millions of records to “local” report overnight (say 10 hours, 10 millions of records per hour, 3000 records per second) – partially and probably because of factors 4 above.


On top of those factors please keep in mind that Tableau is a set of 32-bit applications (with exception of one out of 7 processes on Server side), which is restricted to 2GB of RAM; if data-set cannot fit into RAM, than Tableau Data Engine will use the disk as Virtual RAM, which is much, much slower and for some users such disk space actually not local to his/her workstation and mapped to some “remote” network file server.


Tableau desktop is using in many cases 32-bit ODBC drivers, which may even add more delay into data delivery into local "Visual Report". As we learned from Tableau support itself, even with latest Tableau Server 7.0.X, the RAM allocated for one user session restricted to 3GB anyway.


Unfortunate Update: Tableau 8.0 will be 32-bit application again, but may be follow up version 8.x or 9 (I hope) will be ported to 64-bits... It means that Spotfire, Qlikview and even PowerPivot will keep some advantages over Tableau for a while...

20120531

Data Visualization tool is a Presentation Tool

(this is a repost from my other Data Visualization blog: http://tableau7.wordpress.com/2012/05/31/tableau-as-container/ )

Often I used small Tableau (or Spotfire or Qlikview) workbooks instead of PowerPoint, which are proving at least 2 concepts:


  • Good Data Visualization tool can be used as the Web or Desktop Container for Multiple Data Visualizations (it can be used to build a hierarchical Container Structures with more then 3 levels; currently 3: Container-Workbooks-Views)


  • It can be used as the replacement for PowerPoint; in example below I embedded into this Container 2 Tableau Workbooks, one Google-based Data Visualization, 3 image-based Slides and Textual Slide: http://public.tableausoftware.com/views/TableauInsteadOfPowerPoint/1-Introduction


  • Tableau (or Spotfire or Qlikview) is better then PowerPoint for Presentations and Slides


  • Tableau (or Spotfire or Qlikview) is the Desktop and the Web Container for Web Pages, Slides, Images, Texts


  • Good Visualization Tool can be a Container for other Data Visualizations


  • Sample Tableau Presentation above contains the Introductory Textual Slide


  • Sample Tableau Presentation above  contains a few Tableau Visualization:This Tableau Presentation contains a Web Page with the Google-based Motion Chart Demo


    1. The Drill-down Demo


    2. The Motion Chart Demo ( 6 dimensions: X,Y, Shape, Color, Size, Motion in Time)


  • This Tableau Presentation contains a few Image-based Slides:


    1. The Quick Description of Origins and Evolution of Software and Tools used for Data Visualizations during last 30+ years


    2. The Description of Multi-level Projection from Multidimensional Data Cloud to Datasets, Multidimensional Cubes and to Chart


    3. The Description of 6 stages of Software Development Life Cycle for Data Visualizations


20120524

Data Science and Data Visualization

I am planning for a while to respond on Donald Farmer's comments on my recent blog post about Power View.


But instead I found myself thinking about relationship between Data Science and Data Visualization and yesterday Forbes (thanks to Dan Woods) published Donald's "explanation" about "What is a Data Scientist" and it forced me to write about it here before anything else.


Data Science was under radar until 2001, when various people started to use this term as an unifying umbrella for the set of predictive analytics algorithme, statistical methods, data mining technologies etc. like anomaly and trend detection, dependency and correlation modeling, clustering, classification, regression and summarization, pattern discovery etc.

20120507

Spotfire 4.5 is announced

TIBCO said Spotfire 4.5 will be available later this month (May 2012).


Among news and additions to Spotfire: it will include ADS connector to Hadoop, integration with SAS, Mathworks and Attivio engines and new deployment kit for iPad.

20120424

Tableau vs. Qlikview

Some people pushing me to answer on recent Donald Farmer's comments on my previous post, but I need more time to think about it.


Meanwhile today Ted Cuzzillo published an interesting comparison of Qlikview vs. Tableau here:


http://datadoodle.com/2012/04/24/tableau-qlikview/


named "The future of BI in two words" which made me feel warm and fuzzy about both products and unclear about what Ted's judgement is?


Fortunately I had a more "digitized" comparison of these 2 Data Visualization Leaders, which I did a while ago for a different reason. So I modified it a little to bring it up-to-date and you can see it for yourself below. Funny thing is that even I used 30+ criterias to measure and compare those two brilliant products, final score is almost identical for both of them, so it is still warm and fuzzy.


Basically conclusion is simple: each product is better for certain customers and for certain projects, there is no universal answer (yet?):


[googleapps domain="docs" dir="spreadsheet/pub" query="hl=en_US&hl=en_US&key=0AuP4OpeAlZ3PdHJ1eXZyWFJjUVoxbUl0cTlCVDlXU2c&output=html&widget=true" width="510" height="1060" /]

20120414

Power View: 3rd strike and Microsoft out?

The short version of this post: as far as Data Visualization is a concern, the new Power View from Microsoft is the marketing disaster, the architectural mistake and the generous gift from Microsoft to Tableau, Qlikview, Spotfire and dozens of other vendors.


For the long version - keep reading.


Assume for a minute (OK, just for a second) that new Power View Data Visualization tool from Microsoft SQL Server 2012 is almost as good as Tableau Desktop 7. Now let's compare installation, configuration and hardware involved:


Tableau:


  1. Hardware:  almost any modern Windows PC/notebook (at least dual-core, 4GB RAM).

  2. Installation: a) one 65MB setup file, b) minimum or no skills

  3. Configuration: 5 minutes - follow instructions on screen during installation.

  4. Price - $2K.


Power View:


  1. Hardware: you need at least 2 server-level PCs (each at least quad-core, 16GB RAM recommended). I will not recommend to use 1 production server to host both SQL Server and SharePoint; if you desperate, at least use VM(s).

  2. Installation: a) Each Server  needs Windows 2008 R2 SP1 - 3GB DVD; b) 1st Server needs SQL Server 2012 Enterprise or BI Edition - 4GB DVD; c) 2nd Server needs SharePoint 2010 Enterprise Edition - 1GB DVD; d) A lot of skills and experience

  3. Configurations: Hours or days plus a lot of reading, previous knowledge etc.

  4. Price: $20K or if only for development it is about $5K (Visual Studio with MSDN subscription) plus cost of skilled labor.


As you can see, Power View simply cannot compete on mass market with Tableau (and Qlikview and Spotfire) and time for our assumption in the beginning of this post is expired. Instead now is time to remind that Power View is 2 generations behind Tableau, Qlikview and Spotfire. And there is no Desktop version of Power View, it is only available as a web application through web browser.


Power View is a Silverlight application packaged by Microsoft as a SQL Server 2012 Reporting Services Add-in for Microsoft SharePoint Server 2010 Enterprise Edition. Power View is (ad-hoc) report designer providing for user an interactive data exploration, visualization, and presentation web experience. Microsoft stopped developing Silverlight in favor of HTML5, but Silverlight survived (another mistake) within SQL Server team.


Previous report designers (still available from Microsoft:  BIDS, Report Builder 1.0, Report Builder 3.0, Visual Studio Report Designer) are capable to produce only static reports, but Power View enables users to visually interact with data and drill-down all charts and Dashboard similar to Tableau and Qlikview.


Power View is a Data Visualization tool, integrated with Microsoft ecosystem. Here is a Demo of how the famous Hans Rosling Data Visualization can be reimplemented with Power View:


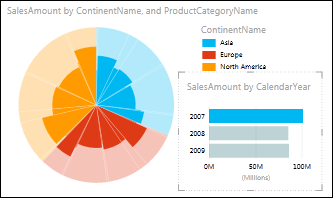
Compare with previous report builders from Microsoft, Power View allows many new features, like Multiple Views in a Single Report, Gallery preview of Chart Images, export to PowerPoint, Sorting within Charts by measures and Categories, Multiple Measures in Charts, Highlighting of selected data in reports and Charts, Synchronization of Slicers (Cross-Filtering), Measure Filters, Search in Filters (convenient for a long lists of categories), dragging data fields into Canvas (create table) or Charts (modify visualization), convert measures to categories ("Do Not Summarize"), and many other features.


As with any of 1st releases from Microsoft, you can find some bugs from Power View. For example, KPIs are not supported in Power View in SQL Server 2012, see it here: http://cathydumas.com/2012/04/03/using-or-not-using-tabular-kpis/


Power View is not the 1st attempt to be a full player in Data Visualization and BI Market. Previous attempts failed and can be counted as Strikes.


Strike 1: The ProClarity acquisition in 2006 failed, there have been no new releases since v. 6.3; remnants of ProClarity can be found embedded into SharePoint, but there is no Desktop Product anymore.


Strike 2: Performance Point Server was introduced in November, 2007, and discontinued two years later. Remnants of Performance Point can be found embedded into SharePoint as Performance Point Services.


Both failed attempts were focused on the growing Data Visualization and BI space, specifically at fast growing competitors such as Qliktech, Spotfire and Tableau. Their remnants in SharePoint functionally are very behind of Data Visualization leaders.


Path to Strike 3 started in 2010 with release of PowerPivot (very successful half-step, since it is just a backend for Visualization) and xVelocity (originally released under name VertiPaq). Power View is continuation of these efforts to add a front-end to Microsoft BI stack. I do not expect that Power View will gain as much popularity as Qlikview and Tableau and in my mind Microsoft will be a subject of 3rd strike in Data Visualization space.


One reason I described in very beginning of this post and the 2nd reason is absence of Power View on desktop. It is a mystery for me why Microsoft did not implement Power View as a new part of Office (like Visio, which is a great success) - as a new desktop application, or as a new Excel Add-In (like PowerPivot) or as a new functionality in PowerPivot or even as a new functionality in Excel itself, or as new version of their Report Builder. None of these options preventing to have a Web reincarnation of it and such reincarnation can be done as a part of (native SSRS) Reporting Services - why involve SharePoint (which is - and I said it many times on this blog - basically a virus)?


I am wondering what Donald Farmer thinking about Power View after being the part of Qliktech team for a while. From my point of view the Power View is a generous gift and true relief to Data Visualization Vendors, because they do not need to compete with Microsoft for a few more years or may be forever. Now IPO of Qliktech making even more sense for me and upcoming IPO of Tableau making much more sense for me too.


Yes, Power View means new business for consulting companies and Microsoft partners (because many client companies and their IT departments cannot handle it properly), Power View has a good functionality but it will be counted in history as a Strike 3.

20120402

Palettes and Colors

(this is a repost from my Tableau blog: http://tableau7.wordpress.com/2012/04/02/palettes-and-colors/ )

I was always intrigued with colors and their usage, since my mom told me that may be ( just may be, there is no direct prove of it anyway) Ancient Greeks did not know what the BLUE color is - that puzzled me.


Later in my live, I realized that Colors and Palettes are playing the huge role in Data Visualization (DV) and it eventually led me to attempt to understand of how it can be used and pre-configured in advanced DV tools to make Data more Visible and to express the Data Patterns better. For this post I used Tableau to produce some palettes, but similar technique can be found in Qlikview, Spotfire etc.


Tableau published the good article of how to create customized palettes here: http://kb.tableausoftware.com/articles/knowledgebase/creating-custom-color-palettes and I followed it below. As this article recommended, I modified default Preferences.tps file; see it below with images of respective Palettes embedded.


For the first, regular Red-Yellow-Green-Blue Palette with known colors with well-established names, I created even a Visualization in order to compare their Red-Green-Blue components and I even tried to placed respective Bubbles on 2-dimensional surface, even originally it is clearly a 3 dimensional Dataset (click on image to see it in full size):


For the 2nd Red-Yellow-Green-NoBlue Ordered Sequential Palette, I tried to implement the extended "Set of Traffic Lights without any trace of BLUE Color" (so Homer and Socrates will understand it the same way as we are) while trying to use only web-safe colors. Please keep in mind, that Tableau does not have a simple way to have more than 20 colors in one Palette, like Spotfire does.


Other 5 Palettes below are useful too as ordered-diverging almost "mono-chromatic" (except Red-Green Diverging, since it can be used in Scorecards when Red is bad and Green is good). So see below Preferences.tps file with my 7 custom palettes.


<?xml version='1.0'?> <workbook> <preferences>
<color-palette name="RegularRedYellowGreenBlue" type="regular">
<color>#FF0000</color> <color>#800000</color> <color>#B22222</color>
<color>#E25822</color> <color>#FFA07A</color> <color>#FFFF00</color>
<color>#FF7E00</color> <color>#FFA500</color> <color>#FFD700</color>
<color>#F0e68c</color> <color>#00FF00</color> <color>#008000</color>
<color>#00A877</color> <color>#99cc33</color> <color>#009933</color>
<color>#0000FF</color> <color>#00FFFF</color> <color>#008080</color>
<color>#FF00FF</color> <color>#800080</color>

</color-palette>

<color-palette name="RedYellowGreenNoBlueOrdered" type="ordered-sequential" >
<color>#ff0000</color> <color>#cc6600</color> <color>#cccc00</color>
<color>#ffff00</color> <color>#99cc00</color> <color>#009900</color>


</color-palette>

<color-palette name="RedToGreen" type="ordered-diverging" >
<color>#ff0000</color> <color>#009900</color> </color-palette>

<color-palette name="RedToWhite" type="ordered-diverging" >
<color>#ff0000</color> <color>#ffffff</color></color-palette>

<color-palette name="YellowToWhite" type="ordered-diverging" >
<color>#ffff00</color> <color>#ffffff</color></color-palette>

<color-palette name="GreenToWhite" type="ordered-diverging" >
<color>#00ff00</color> <color>#ffffff</color></color-palette>

<color-palette name="BlueToWhite" type="ordered-diverging" >
<color>#0000ff</color> <color>#ffffff</color> </color-palette>
</preferences> </workbook>

In case if you wish to use the colors you like, this site is very useful to explore the properties of different colors: http://www.perbang.dk/rgb/