I remember a few years ago Google bought a Gapminder (Hans Rosling did some very impressive Demos
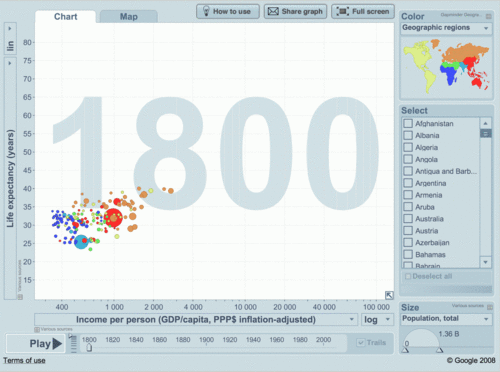
with it a while ago):

and converted it to a Motion Chart "technology" of its own. Motion Chart (For Motion Chart Demo I did below, please Choose a few countries (e.g. check checkboxes for US and France) and then Click on "Right Arrow" button in the bottom left corner of the Motion Chart below)
[googleapps domain="spreadsheets" dir="spreadsheet/pub" query="key=0AuP4OpeAlZ3PdDRwbTVYZFEwdWJUcXk5MS1WM3IzbHc&output=html&widget=true" width="500" height="700" /]
(see also here a sample I did myself, using Google's motion Chart) allows to have 5-6 dimensions crammed into 2-dimensional chart: shape, color and size of bubbles, Axes X and Y as usual (above it will be Life Expectancy and Income per Person) and animated time series (see light blue 1985 in background above - all bubbles will move as "time" goes by). Google uses this and other own visualization technologies in its very useful Public Data Explorer.
Google Fusion Tables is a free service for sharing and visualizing data online. It allows you to upload and share data, merge data from multiple tables into interesting derived tables, and see the most up-to-date data from all sources, it has Tutorials, User's Group, Developer's Guide and sample code, as well as examples. You can check a video here:
The Google Fusion Tables API enables programmatic access to Google Fusion Tables content. It is an extension of Google's existing structured data capabilities for developers. Developer can populate a table in Google Fusion Tables with data, from a single row to hundreds at a time. The data can come from a variety of sources, such as a local database, .CSV file, data collection form, or mobile device. The Google Fusion Tables API is built on top of a subset of the SQL querying language. By referencing data values in SQL-like query expressions, developer can find the data you need, then download it for use by your application. Your app can do any desired processing on the data, such as computing aggregates or feeding into a visualization gadget. Data can be synchronized when you add or change data in the tables in your offline repository, you can ensure the most up-to-date version is available to the world by synchronizing those changes up to Google Fusion Tables.
Everybody knows about Google Web Analytics for your web traffic, visitors, visits, pageviews, length and depth of visits, presented by very simple charts and dashboard, see sample below:

Less people know that Panorama Software has OEM partnership with Google, enabling Google Spreadsheets with SaaS Data Visualizations and Pivot Tables.

Google has Visualization API (and interactive Charts, including all standard Charts, GeoMap, Intensity Map, Map, DyGraph, Sparkline, WordCloud and other Charts) which enables developers to expose own data, stored on any data-store that is connected to the web, as a Visualization compliant datasource. The Google Visualization API also provides a platform that can be used to create, share and reuse visualizations written by the developer community at large. Google provides samples, Chart/API Gallery (Javascript-based visualizations) and Gadget Gallery.
And last but not least, Google has excellent back-end technologies needed for big Data Visualization applications, like BigTable (BigTable is a compressed, high performance, and proprietary database system built on Google File System (GFS), Chubby Lock Service, and a few other Google programs; it is currently not distributed or used outside of Google, although Google offers access to it as part of their Google App Engine) and MapReduce. Add to this list Google Maps and Google Earth

and ask yourself then: what is stopping Google to produce a Competitor for the Holy Trinity (of Qlikview+Spotfire+Tableau) of DV?
Permalink: http://apandre.wordpress.com/2011/02/08/dvgoogle/