8 years ago Hans Rosling demoed on TED the Motion Chart, using Gapminder's Trendalizer. 7 years ago Google bought Trendalizer and incorporated into Google Charts.
A while ago, for my own education and for demo purposes, I implemented various Motion Charts using:
- Tableau (see it here: http://public.tableausoftware.com/views/MotionChart_0/Motion#1 ; for automatic Motion please download it and run it within Free Tableau Reader),
- Qlikview ( Qlikview Demo application can be downloaded from: https://sites.google.com/site/pandre/files/MotionChart.qvw?attredirects=0&d=1 ),
- Google Charts ( see my blogpost here: http://apandre.wordpress.com/dv-by-pandre/motion-chart-demo/ )
- etc.
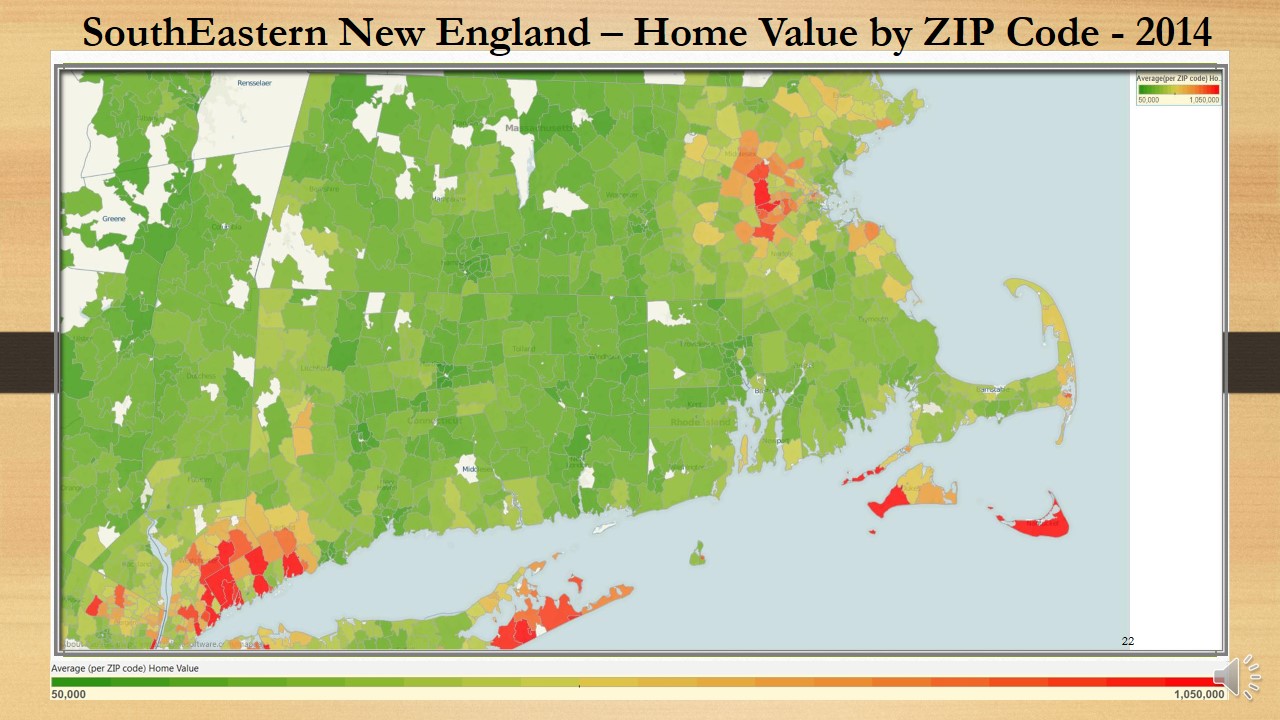
To implement Motion Chart in Tableau, you can use Page Shelf and place there either a Timing dimension (I used Dimension "Year" in Tableau example above) or even Measures Names (Average Monthly Home Value per ZIP Code) in my implementation of Motion Map Chart below.