Discover, Analyze, Explore, Pivot, Drilldown, Visualize your data… “How do I know what I think until I see what I say?” [E.M. Forster, G. Wallas, A. Gide]
My Best Wishes for 2014 to all visitors of this Blog!
2013 was very successful year for Data Visualization (DV) community, Data Visualization vendors and for this Data Visualization Blog (number of visitors per grew from average 16000 to 25000+ per month).
From certain point of view 2013 was the year of Tableau - it went public, Tableau has now the largest Market Capitalization among DV Vendors (more than $4B as of Today) and its strategy (Data to the People!) became the most popular among DV users and it had (again) largest YoY revenue growth (almost 75% !) among DV Vendors. Tableau already employed more than 1100 people and still has 169+ job openings as of today. I wish Tableau to stay the Leader of our community and to keep their YoY above 50% - this will not be easy.
Qliktech is the largest DV Vendor and it will exceed in 2014 the half-billion dollars benchmark in revenue (probably closer to $600M by end of 2014) and will employ almost 2000 employees. Qlikview is one of the best DV product on market. I wish in 2014 Qlikview will create Cloud Services, similar to Tableau Online and Tableau Public and I wish Qlikview.Next will keep Qlikview Desktop Professional (in addition to HTML5 client).
I wish TIBCO will stop trying to improve BI or make it better - you cannot reanimate a dead horse; instead I wish Spotfire will embrace the approach "Data to the People" and act accordingly. For Spotfire my biggest wish is that TIBCO will spin it off the same way EMC did with VMWare. And yes, I wish Spofire Cloud Personal will be free and enabled to read at least local flat files and local DBs like Access.
2014 (or may be 2015?) can witness new, 4th DV player coming to competition: Datawatch bought recently Panopticon and if it will complete integration of all products correctly and add features which other DV vendors above already have (like Cloud Services), it can be very competitive player. I wish them luck!
Microsoft released in 2013 a lot of advanced and useful DV-related functionality and I wish (I recycling this wish for many years now) that Microsoft finally will package the most its Data Visualization Functionality in one DV product and add it to Office 20XX (like they did with Visio) and Office 365 instead of bunch of plug-ins to Excel and SharePoint.
It is a mystery for me why Panorama, Visokio and Advizor Solutions still relatively small players, despite all 3 of them having an excellent DV features and products. Based on 2013 IPO experience with Tableau may be the best way for them to go public and get new blood? I wish to them to learn from Tableau and Qlikview success and try this path in 2014-15...
For Microstrategy my wish is very simple - they are only traditional BI player who realised that BI is dead and they started in 2013 (actually before then 2013) a transition into DV market and I wish them all success they can handle!
I also think that a few thousands of Tableau, Qlikview and Spotfire customers (say 5% of customer base) will need (in 2014 and beyond) more deep Analytics and they will try to complement their Data Visualizations with Advanced Visualization technologies they can get from vendors like http://www.avs.com/
Since we approaching (in USA that is) a Thanksgiving Day for 2013 and shopping is not a sin for few days, multiple blog visitors asked me what hardware advise I can share for their Data Science and Visualization Lab(s). First of all I wish you will get a good Turkey for Thanksgiving (below is what I got last year):
I cannot answer DV Lab questions individually - everybody has own needs, specifics and budget, but I can share my shopping thoughts about needs for Data Visualization Lab (DV Lab). I think DV Lab needs many different types of devices: smartphones, tablets, projector (at least 1), may be a couple of Large Touchscreen Monitors (or LED TVs connectable to PCs), multiple mobile workstations (depends on size of DV Lab team), at least one or two super-workstation/server(S) residing within DV Lab etc.
Smartphones and Tablets
I use Samsung Galaxy S4 as of now, but for DV Lab needs I will consider either Sony Xperia Z Ultra or Nokia 1520 with hope that Samsung Galaxy S5 will be released soon (and may be it will be the most appropriate for DV Lab):
My preference for Tablet will be upcoming Google Nexus 10 (2013 or 2014 edition - it is not clear, because Google is very secritive about it) and in certain cases Google Nexus 7 (2013 edition). Until Nexus 10 ( next generation) will be released, I guess that two leading choices will be ASUS Transformer Pad TF701T
and Samsung Galaxy Note 10.1 2014 edition (below is a relative comparison of the size of these 2 excellent tablets):
Projectors, Monitors and may be Cameras.
Next piece of hardware in my mind is a projector with support for full HD resolution and large screens. I think there are many good choices here, but my preference will be BENQ W1080ST for $920 (please advise if you have a better projector in mind in the same price range):
So far you cannot find too many Touchscreen Monitors for reasonable price, so may be these two 27" touchscreen monitors (DELL P2714T for $620 or Acer T272HL bmidz for $560) are good choices for now:
I also think that a good digital camera can help to Data Visualization Lab and considering something like this (can be bought for $300): Panasonic Lumix DMC FZ72 with 60X optical zoom and ability to do a Motion Picture Recording as HD Video in 1,920 x 1,080 pixels - for myself:
Mobile and Stationary Workstations and Servers.
If you need to choose CPU, I suggest to start with Intel's Processor Feature Filter here: http://ark.intel.com/search/advanced . In terms of mobile workstations you can get quad-core notebook (like Dell 4700 for $2400 or Dell Precison 4800 or HP ZBook 15 for $3500) with 32 GB RAM and decent configuration with multiple ports, see sample here:
If you are OK with 16GB of RAM for your workstation, you may prefer Dell M3800 with excellent touchscreen monitor (3200x1800 resolution) and only 2 kg of weight. For a stationary workstation (or rather server) good choices are Dell Precision T7600 or T7610 or HP Z820 workstation. Either of these workstations (it will cost you!) can support up to 256GB RAM, up to 16 or even 24 cores in case of HP Z820), multiple high-capacity hard disks and SSD, excellent Video Controllers and multiple monitors (4 or even 6!) Here is an example of backplane for HP Z820 workstation:
I wish to visitors of this blog a Happy Holidays and good luck with their DV Lab Shopping!
With releases of Spotfire Silver, Tableau Online and attempts of a few Qlikview Partners (but not Qliktech itself yet) to the Cloud and providing their Data Visualization Platforms and Software as a Service, the Attributes, Parameters and Concerns of such VaaS or DVaaS ( Visualization as a Service) are important to understand. Below is attempt to review those "Cloud" details at least on a high level (with natural limitation of space and time applied to review).
But before that let's underscore that Clouds are not in the skies but rather in huge weird buildings with special Physical and Infrastructure security likes this Data Center in Georgia:
You can see some real old fashion clouds above the building but they are not what we are talking about. Inside Data Center you can see a lot of Racks, each with 20+ servers which are, together with all secure network and application infrastructure contain these modern "Clouds":
Attributes and Parameters of mature SaaS (and VaaS as well) include:
24/7 high availability: Facilities with reliable and backup power and cooling, Certified Network Infrastructure, N+1 Redundancy, 99.9% (or 99.99% or whatever your SLA with clients promised) up-time
Detailed historical availability, performance and planned maintenance data with Monitoring and Operational Dashboards, Alerts and Root Cause Analysis
Disaster recovery plan with multiple backup copies of customers’ data in near real time at the disk level, a
multilevel backup strategy that includes disk-to-disk-to-tape data backup where tape backups serve as a secondary level of backup, not as their primary disaster recovery data source.
Fail-over that cascades from server to server and from data center to data center in the event of a regional disaster, such as a hurricane or flood.
While Security, Privacy, Latency and Hidden Cost usually are biggest concerns when considering SaaS/VaaS, other Cloud Concerns surveyed and visualized below. Recent survey and diagram are published by Charlie Burns this month:
Other survey and diagram are published by Shane Schick in October 2011 and in February of 2013 by KPMG. Here are concerns, captured by KPMG survey:
As you see above, Rack in Data Center can contain multiple Servers and other devices (like Routers and Switches, often redundant (at least 2 or sometimes N+1). Recently I designed the Hosting Data VaaS Center for Data Visualization and Business Intelligence Cloud Services and here are simplified version of it just for one Rack as a Sample.
You can see redundant network, redundant Firewalls, redundant Switches for DMZ (so called "Demilitarized Zone" where users from outside of firewall can access servers like WEB or FTP), redundant main Switches and Redundant Load Balancers, Redundant Tableau Servers, Redundant Teradata Servers, Redundant Hadoop Servers, Redundant NAS servers etc. (not all devices shown on Diagram of this Rack):
20 months ago I checked how many job openings leading DV Vendors have. On 12/5/11 Tableau had 56, Qliktech had 46 and Spotfire had 21 openings. Today morning I checked their career sites again and noticed that both Tableau and Qliktech almost double their thirst for new talents, while Spotfire basically staying on the same level of hiring needs:
Tableau has 102(!) openings, 43 of them are engineering positions (I counted their R&D positions and openings in Operation department too) - that is huge! Update as of 9/18/13 has exactly 1000 employees. 1000th employee can be found on this picture
Qliktech has 87 openings, 29 of them are engineering positions (I included R&D, IT, Tech Support and Consulting).
TIBCO/Spotfire has 24 openings, 16 of them are engineering positions (R&D, IT, Tech.Support).
All 3 companies are Public now, so I decided to include their Market Capitalization as well. Since Spofire is hidden inside its corporate parent TIBCO, I used my estimate that Spotfire's Capitalization is about 20% of TIBCO's capitalization (which is $3.81B as of 8/23/13, see https://www.google.com/finance?q=TIBX ). As a result I have this Market Capitalization numbers for 8/23/13 as closing day:
Spotfire - $0.76B (my rough estimate as 20% of TIBCO's capitalization; I wish it will be more for such a mature and excellent product and team, but TIBCO does not want to capitalize on Data Visualization market. I think that the best way for TIBCO to take advantage of Spotfire is to spin it off the same way EMC ($55B Market Cap) did with VMWare (currently $37.7B)). Update on 9/10/13: Akram Annous validated my 3+ years old idea of Spotfire's spinoff in this article @SeekingAlpha: http://seekingalpha.com/article/1684032-is-tibco-dan-loebs-next-pet-project
Those 3 DV Vendors above together have almost $8B market capitalization as of evening of 8/23/13 !
Market Capitalization update as of 8/31/13: Tableau: $4.3B, Qliktech $2.9B, Spotfire (as 20% of TIBCO) - $0.72B
Market Capitalization update as of 9/4/13 11pm: Tableau: $4.39B, Qliktech $3B, Spotfire (as 20% of TIBCO) - $0.75B . Also as of today Qliktech employed 1500+ (approx. $300K revenue per year per employee), Tableau about 1000 (approx. $200K revenue per year per employee) and Spotfire about 500+ (very rough estimate, also approx. $350K revenue per year per employee)
I got many questions from Data Visualization Blog's visitors about differences between compensation for full-time employees and contractors. It turned out that many visitors are actually contractors, hired because of their Tableau or Qlikview or Spotfire skills and also some visitors consider a possibility to convert to consulting or vice versa: from consulting to FullTimers. I am not expert in all these compensation and especially benefits-related questions, but I promised myself that my blog will be driven by vistors's requests, so I google a little about Contractor vs. Full-Time worker compensation and below is brief description of what I got:
Federal Insurance Contribution Act mandates Payroll Tax splitted between employer (6.2% Social Security with max $$7049.40 and 1.45% Medicare on all income) and employee, with total (2013) as 15.3% of gross compensation.
In addition you have to take in account employer's contribution (for family it is about $1000/per month) to medical benefits of employee, Unemployment Taxes, employer's contribution to 401(k), STD and LTD (short and long term disability insurances), pension plans etc.
I also added into my estimate of contractor rate the "protection" for at least 1 month GAP between contracts and 1 month of salary as bonus for full-time employees.
Basically the result of my minimal estimate as following: you need to get as a contractor the rate at least 50% more than base hourly rate of the full-time employee. This base hourly rate of full-time employee I calculate as employee's base salary divided on 1872 hours: 1872 = (52 weeks*40 hours - 3 weeks of vacation - 5 sick days - 6 holidays) = 2080 hours - 208 hours (Minimum for a reasonable PTO, Personal Time Off) = 1872 working hours per year.
I did not get into account any variations related to the usage of W2 or 1099 forms or Corp-To-Corp arrangements and many other fine details (like relocation requirements and overhead associated with involvement of middlemen like headhunters and recruiters) and differences between compensation of full-time employee and consultant working on contract - this is just a my rough estimate - please consult with experts and do not ask me any questions related to MY estimate, which is this:
Contractor Rate should be 150% of the base rate of a FullTimer
In general, using Contractors (especially for business analytics) instead of Full-timers is basically the same mistake as outsourcing and off-shoring: companies doing that do not understand that their main assets are full-time people. Contractors are usually not engaged and they are not in business to preserve intellectual property of company.
On May 3rd of 2012 the Google+ extension http://tinyurl.com/VisibleData of this Data Visualization blog reached 500+ followers, on July 9 it got 1000+ users, on October 11 it had already 2000+ users, 11/27/12 my G+ Data Visualization Page has 2190+ followers and still growing every day (updated as of 12/01/12: 2500+ followers.
One of reasons of course is just a popularity of Data Visualization related topics and other reason covered in interesting article here:
In any case, it helped me to create a reading list for myself and other people, base on feedback I got. According to CicleCount, as of 11/13/12 update, my Data Visualization Google+ Page ranked as #178 most popular page in USA. Thank you G+ !
Update 5/25/13: G+ extension of this blog now has 3873+ followers and as of 7/15/13 as of 4277+ followers):
The short version of this post: as far as Data Visualization is a concern, the new Power View from Microsoft is the marketing disaster, the architectural mistake and the generous gift from Microsoft to Tableau, Qlikview, Spotfire and dozens of other vendors.
For the long version - keep reading.
Assume for a minute (OK, just for a second) that new Power View Data Visualization tool from Microsoft SQL Server 2012 is almost as good as Tableau Desktop 7. Now let's compare installation, configuration and hardware involved:
Tableau:
Hardware: almost any modern Windows PC/notebook (at least dual-core, 4GB RAM).
Installation: a) one 65MB setup file, b) minimum or no skills
Configuration: 5 minutes - follow instructions on screen during installation.
Price - $2K.
Power View:
Hardware: you need at least 2 server-level PCs (each at least quad-core, 16GB RAM recommended). I will not recommend to use 1 production server to host both SQL Server and SharePoint; if you desperate, at least use VM(s).
Configurations: Hours or days plus a lot of reading, previous knowledge etc.
Price: $20K or if only for development it is about $5K (Visual Studio with MSDN subscription) plus cost of skilled labor.
As you can see, Power View simply cannot compete on mass market with Tableau (and Qlikview and Spotfire) and time for our assumption in the beginning of this post is expired. Instead now is time to remind that Power View is 2 generations behind Tableau, Qlikview and Spotfire. And there is no Desktop version of Power View, it is only available as a web application through web browser.
Power View is a Silverlight application packaged by Microsoft as a SQL Server 2012 Reporting Services Add-in for Microsoft SharePoint Server 2010 Enterprise Edition. Power View is (ad-hoc) report designer providing for user an interactive data exploration, visualization, and presentation web experience. Microsoft stopped developing Silverlight in favor of HTML5, but Silverlight survived (another mistake) within SQL Server team.
Previous report designers (still available from Microsoft: BIDS, Report Builder 1.0, Report Builder 3.0, Visual Studio Report Designer) are capable to produce only static reports, but Power View enables users to visually interact with data and drill-down all charts and Dashboard similar to Tableau and Qlikview.
Power View is a Data Visualization tool, integrated with Microsoft ecosystem. Here is a Demo of how the famous Hans Rosling Data Visualization can be reimplemented with Power View:
Compare with previous report builders from Microsoft, Power View allows many new features, like Multiple Views in a Single Report, Gallery preview of Chart Images, export to PowerPoint, Sorting within Charts by measures and Categories, Multiple Measures in Charts, Highlighting of selected data in reports and Charts, Synchronization of Slicers (Cross-Filtering), Measure Filters, Search in Filters (convenient for a long lists of categories), dragging data fields into Canvas (create table) or Charts (modify visualization), convert measures to categories ("Do Not Summarize"), and many other features.
Power View is not the 1st attempt to be a full player in Data Visualization and BI Market. Previous attempts failed and can be counted as Strikes.
Strike 1: The ProClarity acquisition in 2006 failed, there have been no new releases since v. 6.3; remnants of ProClarity can be found embedded into SharePoint, but there is no Desktop Product anymore.
Strike 2: Performance Point Server was introduced in November, 2007, and discontinued two years later. Remnants of Performance Point can be found embedded into SharePoint as Performance Point Services.
Both failed attempts were focused on the growing Data Visualization and BI space, specifically at fast growing competitors such as Qliktech, Spotfire and Tableau. Their remnants in SharePoint functionally are very behind of Data Visualization leaders.
Path to Strike 3 started in 2010 with release of PowerPivot (very successful half-step, since it is just a backend for Visualization) and xVelocity (originally released under name VertiPaq). Power View is continuation of these efforts to add a front-end to Microsoft BI stack. I do not expect that Power View will gain as much popularity as Qlikview and Tableau and in my mind Microsoft will be a subject of 3rd strike in Data Visualization space.
One reason I described in very beginning of this post and the 2nd reason is absence of Power View on desktop. It is a mystery for me why Microsoft did not implement Power View as a new part of Office (like Visio, which is a great success) - as a new desktop application, or as a new Excel Add-In (like PowerPivot) or as a new functionality in PowerPivot or even as a new functionality in Excel itself, or as new version of their Report Builder. None of these options preventing to have a Web reincarnation of it and such reincarnation can be done as a part of (native SSRS) Reporting Services - why involve SharePoint (which is - and I said it many times on this blog - basically a virus)?
I am wondering what Donald Farmer thinking about Power View after being the part of Qliktech team for a while. From my point of view the Power View is a generous gift and true relief to Data Visualization Vendors, because they do not need to compete with Microsoft for a few more years or may be forever. Now IPO of Qliktech making even more sense for me and upcoming IPO of Tableau making much more sense for me too.
Yes, Power View means new business for consulting companies and Microsoft partners (because many client companies and their IT departments cannot handle it properly), Power View has a good functionality but it will be counted in history as a Strike 3.
Internet has a lot of articles, pages, blogs, data, demos, vendors, sites, dashboards, charts, tools and other materials related to Data Visualization and this Google+ page will try to point to most relevant items and sometimes to comment on most interesting of them.
.
What was unexpected is a fast success of this Google+ page - in a very short time it got 200+ followers and that number keeps growing!
On Friday July 8, 2011, the closing price of Qliktech's share (symbol QLIK) was $35.43. Yesterday January 6, 2012, QLIK closed with price $23.21. If you consider yesterday's price as 100% than QLIK (blue line below) lost 52% of value in just 6 months, while Dow Jones (red line below) basically lost only 2-3% :
Since Qliktech's Market Capitalization as of yesterday evening was about $1.94B, it means that Qliktech lost in last 6 month about 1 billion dollars in capitalization! That is a sad observation to make and made me wonder why it happened?
I see nothing wrong with Qlikview software, in fact everybody knows (and this blog is the prove for it) that I like Qlikview very much.
So I tried to guess for reasons (for that lost) below, but it just my guesses and I will be glad if somebody will prove me mistaken and explain to me the behavior of QLIK stock during last 6 months...
2011 supposed to be the year of Qliktech: it had successful IPO in 2010, it doubled the size of its workforce (I estimate it has more than 1000 employees by end of 2011), it sales grew almost 40% in 2011, it kept updating Qlikview and it generated a lot of interest to it's products and to Data Visualization market. In fact Qlliktech dominated its market and its marketshare is about 50% (of Data Visualization market).
So I will list below my guesses about factors which influenced QLIK stock and I do not think it was only one or 2 major factors but rather a combination of them (I may guess wrong or miss some possible reasons, please correct me):
P/E Ratio (price-to-earnings) for QLIK is 293 (and it was even higher), which may indicate that stock is overvalued and investors expectations are too high.
Company insiders (Directors and Officers) were very active lately selling their shares, which may affected the prices of QLIK shares.
56% of Qliktech's sales are coming from Europe and European market is not growing lately.
58% of Qliktech's sales are coming from existing customers and it can limit the speed of growth.
Most new hires after IPO were sales, pre-sales, marketing and other non-R&D types.
Qliktech's offices are too diversified for its size (PA, MA, Sweden etc.) and what is especially unhealthy (from my view) is that R&D resides mostly in Europe while Headquarters, marketing and other major departments reside far from R&D - in USA (mostly in Radnor, PA)
2011 turned to be a year of Tableau (as oppose to my expectation to be a year of Qlikview) and Tableau is winning the battle for mindshare with its Tableau Public web service and its free Desktop Tableau Reader, which allows to distribute Data Visualizations without any Web/Application Servers and IT personnel to be involved. Tableau is growing much faster then Qliktech and it generates a huge momentum, especially in USA, where Tableau's R&D,QA, Sales, Marketing and Support all co-reside in Seattle, WA.
Tableau has the best support for Data Sources; for example, which is important due soon to be released SQL Server 2012, Tableau has the unique ability to read Multidimensional OLAP Cubes from SQL Server Analysis Services and from local Multidimensional Cubes from PowerPivot. Qlikview so far ignored Multidimensional Cubes as data sources and I think it is a mistake.
Tableau Software, while it is 3 or 4 times smaller then Qliktech, managed to be able to have more job openings then Qliktech and many of them in R&D, which is a key for a future growth! Tableau's sales in 2011 reached $72M, workforce is 350+ now (160 of them were hired in 2011!), number of customers is more then 7000 now...
In case if you miss it, 2011 was successful for Spotfire too. In Q4 2011 Earnings Call Transcript, TIBCO "saw demand simply explode across" some product areas. According to TIBCO, "Spotfire grew over 50% in license revenue for the year and has doubled in the past two years". If it is true, that means Spotfire Sales actually approached $100M in 2011.
As Neil Charles noted, that Qliktech does not have transparent pricing and "Qlikview's reps are a nightmare to talk to. They want meetings; they want to know all about your business; they promise free copies of the software. What they absolutely will not do is give you a figure for how much it's going to cost to deploy the software onto x analysts' desktops and allow them to publish to a server." I tend to agree that Qliktech's pricing policies are pushing many potential customers away from Qlikview toward Tableau where almost all prices known upfront.
I hope I will wake up next morning or next week or next month or next quarter and Qliktech somehow will solve all these problems (may be perceived just by me as problems) and QLIK shares will be priced higher ($40 or above?) than today - at least it is what I wish to my Qliktech friends in new 2012...
Update on 3/2/12 evening: it looks like QLIK shares reading my blog and trying to please me: during last 2 months they regained almost $9 (more then 30%), ending the 3/2/12 session with $29.99 price and regaining more then $550M in market capitalization (qlik on chart to get full-size image of it):
I guess if QLIK will go in wrong direction again, I have to blog about it, and it will correct itself!
One of the most popular posts on this blog was a comparison of Data Visualization Tools, which originally was posted more then a year ago where I compared those best tools only qualitatively. However since then I got a lot of requests to compare those tools "quantitatively". Justification for such update were recent releases of Spotfire 4.0, Qlikview 11, Tableau 7.0 and Microsoft's Business Intelligence Stack (mostly SQL Server 2012 and PowerPivot V.2.)
.
However I quickly realized that such "quantitative" comparison cannot be objective. So here it is - the updated and very subjective comparison of best Data Visualization tools, as I see them at the end of 2011. I know that many people will disagree with my assessment, so if you do not like my personal opinion - please disregard it at "your own peril". I am not going to prove "numbers" below - they are just my personal assessments of those 4 technologies - I love all 4 of them. Feel free to make your own comparison and if you can share it with me - I will appreciate it very much.
.
Please keep in mind that I reserve the right to modify this comparison overtime if/when I will learn more about all those technologies, their vendors and usage. Criterias used in comparison below listed in 1st column and they are grouped in 3 groups: business, visualization and technical. Columns 2-5 used for my assessments of 4 technologies, last column used for my subjective weights for each criteria and last row of this worksheet has Total for each Data Visualization technology I evaluated.
I said on this blog many times that 80% of Data Visualization (DV) is ... Data.
SQL Server 2012 is here.
And technology and process of how these Data collected, extracted, transformed and loaded into DV backend and frontend is a key to DV success. It seems to me that one of the best possible technology for building DV backend is around the corner as SQL Server 2012 will be released soon - Release Candidate for it is out...
And famous Microsoft marketing machine is not silent about it. SQL Server 2012 Virtual Launch Event planned for March 7, 2012 and real release probably at the end of March 2012.
Columnstore Index.
I already mentioned on this blog the most interesting feature for me - the introduction of Columnstore Index (CSI) can transform SQL Server into Columnar Database (for DV purposes) and accelerates DV-relevant Queries by 10X or even 100X of times. Oracle does not have it!
.
Some reasonable rules and features applied to CSI: each table can have only one CSI; CSI has Row grouping (about million rows, like paging for columns); table with CSI cannot be replicated. New (unified for small and large memory allocations) memory manager optimized for Columnstore Indexes, supports Windows 8 maximum memory and logical processors.
Power View.
SSRS (Reporting Services) got massive improvements, including new Power View as Builder/Viewer of interactive Reports. I like this feature: "even if a table in the view is based on an underlying table that contains millions of rows, Power View only fetches data for the rows that are visible in the view at any one time" and UI features (some of them are standard for existing Data Visualization tools, like multiple views in Power View reports (see gallery of thumbnails in the bottom of screenshot below):
.
"2 clicks to results", export to PowerPoint etc. See also video here:
.
.
PowerView is still far behind Tableau and Qlikview as a Visualizer, but at least it makes SSRS reports more interactive and development of them easier. Below are some thumbnails of Data Visualization samples produced with PowerView and presented by Microsoft:
Support for Big Data.
SQL Server 2012 has a lot new features like "deep" HADOOP support (including Hive ODBC Driver) for "big data" projects, ODBC drivers for Linux, grouping databases into Availability Group for simultaneous failover, Contained Databases (enable easy migration from one SQL Server instance to another) with contained Database users.
Parallel Data Warehouse, Azure, Data Explorer.
And don't forget PDW (SQL Server-based Parallel Data Warehouse; massive parallel processing (MPP) provides scalability and query performance by running independent servers in parallel with up to 480 cores) and SQL Azure cloud services with it high availability features...
.
New Data Explorer allows discover data in the cloud and import them from standard and new data sources, like OData, Azure Marketplace, HTML etc. and visualize and publish your Data to the cloud.
LocalDB.
LocalDB is a new free lightweight deployment option for SQL Server 2012 Express Edition with fewer prerequisites that installs quickly. It is an embedded SQL Server database for desktop applications (especially for DIY DV apps) or tools. LocalDB has all of the same programability features as SQL Server 2012 Express, but runs in user mode with applications and not as a service. Application that use LocalDB simply open a file. Once a file is opened, you get SQL Server functionality when working with that file, including things like ACID transaction support. It’s not intended for multi-user scenarios or to be used as a server. (If you need that, you should install SQL Server Express.)
BIDS.
SQL Server 2012 is restoring a very desirable feature, which was missing in Visual Studio 2010 for 2+ years - something called BIDS (BI Development Studio was available as part of Visual Studio 2008 and SQL Server 2008). For that a developer needs VS2010 installed with SP1 and then install "SQL Server Data Tools" (currently it is in the state of CTP4, but I guess it will be a real thing when when SQL Server 2012 will be released to production).
SSAS, Tabular Mode, PowerPivot, DAX.
Most important improvement for BI and Data Analytics will be of course the changes in SSAS (SQL Server Analysis Services), including the addition of Tabular Mode, restoration of BIDS (see above), the ability to design local multidimensional cubes with PowerPivot and Excel and then deploy them directly from Excel as SSAS Cubes, the new DAX language shared between PowerPivot and SSAS, and availability of all those Excel Services directly from SSAS without any need for SharePoint. I think those DV tools who will able to connect to those SSAS and PowerPivot Cubes will have a huge advantage. So far only Tableau has it (and Omniscope has it partially).
Backend for Data Visualization.
All of these features making SQL Server 2012 a leading BI stack and backend for Data Visualization applications and tools. I just wish that Microsoft will develop an own DV front-end tool, similar to Tableau or Qlikview and integrate it with Office 201X (like they did with Visio), but I guess that DV market ( approaching $1B in 2012) is too small compare with markets for Microsoft Office and SQL Server.
Pricing.
Now is time for a "bad news". The SQL Server 2012 CAL price will increase by about 27%. New pricing you can see below and I predict you will not like it:
Data Visualization has at least 3 parts: largest will be a Data, the most important part will be a Story behind those Data and a View (or Visualization) is just an Eye Candy on top of it. However only a View allows users to interact, explore, analyze and drilldown those Data and discover the Actionable Info, which is why Data Visualization (DV) is such a Value for business user in the Big (and even in midsized) Data Universe.
Productivity Gain.
One rarely covered aspect of advanced DV usage is a huge a productivity gain for application developer(s). I recently had an opportunity to estimate a time needed to develop an interactive DV reporting application in 2 different groups of DV & BI environments
Samples of Traditional and Popular BI Platforms.
Open Source toolsets like Jaspersoft 4/ Infobright 4/ MySQL (5.6.3)
MS BI Stack (Visual Studio/C#/.NET/DevExpress/SQL Server 2012)
Tried and True BI like Microstrategy (9.X without Visual Insight)
Samples of Advanced DV tools, ready to be used for prototyping
Spotfire (4.0)
Tableau (6.1 or 7.0)
Qlikview (11.0)
Results proved a productivity gain I observed for many years now: first 3 BI environments need month or more to complete and last 3 DV toolsets required about a day to complete entire application. The same observation done by ... Microstrategy when they added Visual Insight (in attempt to compete with leaders like Qlikview, Tableau, Spotfire and Omniscope) to their portfolio (see below slide from Microstrategy presentation earlier this year, this slide did not count time to prepare the data and assume they are ready to upload):
I used this productivity gain for many years not only for DV production but for Requirement gathering, functional Specifications and mostly importantly for a quick Prototyping. Many years ago I used Visio for interactions with clients and collecting business requirements, see the Visio-produced slide below as an approximate example:
DV is the best prototyping approach for traditional BI
This leads me to a surprising point: modern DV tools can save a lot of development time in traditional BI environment as ... a prototyping and requirement gathering tool. My recent experience is that you can go to development team which is completely committed for historical or other reasons to a traditional BI environment (Oracle OBIEE, IBM Cognos, SAP Business Objects, SAS, Microstrategy etc.) and prototype for such team dozens and hundreds new (or modify existing) reports in a few days or weeks and give it to the team to port it to their traditional environment.
These DV-based prototypes have completely different behavior from previous generation of (mostly MS-Word and PowerPoint based) BRD (Business Requirement Documents), Functional Specification, Design Documents and Visio-based application Mockups and prototypes: they are living interactive applications with real-time data updates, functionality refreshes in a few hours (in most cases at the same day as new request or requirement is collected) and readiness to be deployed into production anytime!
However, my estimate that 9 out of 10 such BI teams, even they will be impressed by prototyping capabilities of DV tools (and some will use them for prototyping!), will stay with their environment for many years due political (can you say job security) or other (strange to me) reasons, but 1 out of 10 teams will seriously consider to switch to Qlikview/Tableau/Spotfire. I see this as a huge marketing opportunity for DV vendors, but I am not sure that they know how to handle such situation...
Example: using Tableau for Storytelling: [youtube=https://www.youtube.com/watch?v=_2u-cQED1ek]
Spreadsheets (VisiCalc or "Visible Calculator" was released by Dan Bricklin and Bob Frankston in October 1979 - 32 years ago - originally for Apple II computer) were one of the very first Business Intelligence (BI) software (sold over 700,000 copies in six years).
For historical purposes I have to mention that VisiCalc actually was not the first spreadsheet program invented (for example I am aware of multi-user spreadsheet software written before VisiCalc in USSR in PL/1 for mainframes with IBM's IMS Database as a backend ), but it is a first commercial spreadsheet introduced on American market and it was a turning point of PC industry.
The "Visible Calculator" went on sale in November of 1979 and was a big hit. It retailed for US$100 and sold so well that many dealers started bundling the Apple II with VisiCalc. The success of VisiCalc turned Apple into a successful company, selling tens of thousands of the pricey 32 KB Apple IIs (no matter how hard Bob Frankston tried, he could not fit VisiCalc in the 16 KB of RAM on the low-end Apple II. VisiCalc would only be available for the much more expensive 32 KB Apple II) to businesses that wanted them only for the spreadsheet. Version of VisiCalc for Atari was even retailed for $200!
VisiCalc was published without any Patent and it is a living prove that Patent System currently is useless for people, abused by large corporations for their own benefit, and it is actually a brake for innovations and it is not protecting inventors. Absence of patent protection for VisiCalc created the Spreadsheet Revolution and Innovations (SuperCalc, Lotus 1-2-3, QuattroPro, Excel, OpenOffice's Calc, Google's Spreadsheets and many others) and tremendously accelerated PC industry.
As Dan Bricklin said it by himself "We all borrowed from each other" and as George Bernard Shaw said: "If you have an apple and I have an apple and we exchange these apples then you and I will still each have one apple.But if you have an idea and I have an idea and we exchange these ideas, then each of us will have two ideas."
Application of Spreadsheets in the BI field began with the integration of OLAP (On-Line Analytical Processing) and Pivot tables. In 1991, Lotus (in addition to 1-2-3) released Improv with Pivoting functionality (also see Quantrix as a reborned [originally in 1994-95] Improv), followed by Microsoft’s release (in Excel 5) of PivotTable in 1993 (trademarked by Microsoft). 500+ millions people currently using Excel and at least 5% of them using it for BI and Data Visualization purposes. PowerPivot added to Excel 2010 speedy and powerful in-memory columnar database which enables millions of end-users to have a self-serviced BI.
Essbase was the first scalable OLAP software to handle large data sets that the early spreadsheet software was incapable of. This is where its name comes from: Extended Spread Sheet Database (Essbase owned by Oracle now). Currently one of the best OLAP and BI software is SSAS (Analysis Services from Microsoft SQL Server 2008 R2 and upcoming SQL Server 2012 with its new Tabular mode) and Excel 2010 with its PowerPivot, PivotTables and Pivot Charts is one of the most popular front-end for SSAS.
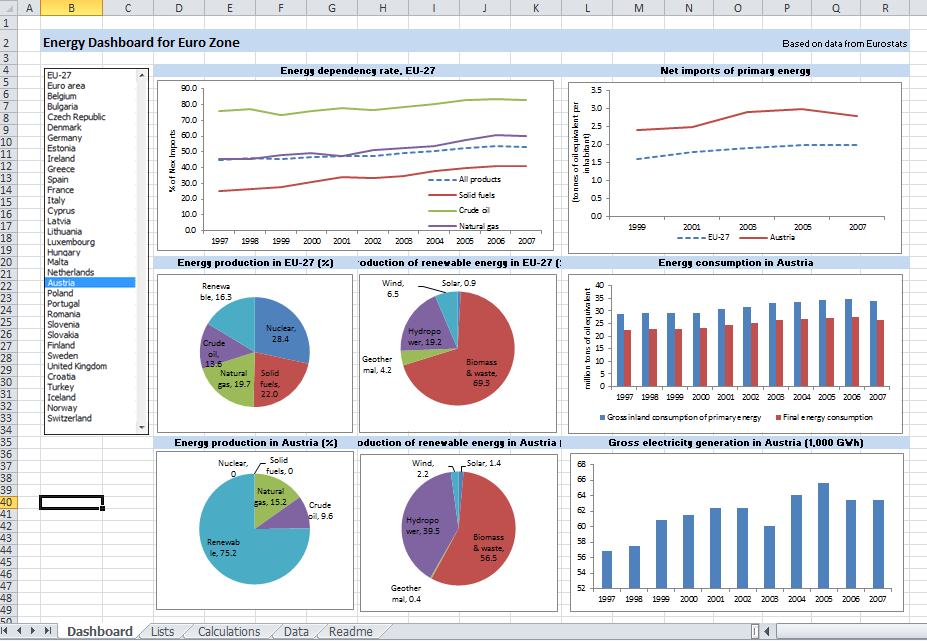
There is no doubt that Excel is the most commonly used software for "BI purposes". While Excel is general business software, its flexibility and ease of use makes it popular for data analysis with millions of users worldwide. Excel has an install base of hundreds of millions of desktops: far more than any other "BI platform". It has become a household name.With certain precaution it can be used for a good or at least prototyping Data Visualization (most of charts below created with Excel):
From educational utilization to domestic applications to prototyping (or approximated) Data Visualization and enterprise implementation, Excel has been proven incredibly indispensable. Most people with commercial or corporate backgrounds have developed a proficient Excel skillset. This makes Excel the ultimate self-service BI platform and spreadsheet technologies as a common ground for all viable Data Visualization technologies on market.
7 months ago I published a poll on LinkedIn and got a lot of responses, 1340 votes (in average 1 vote per hour) and comments. People asked me many times to repeat this poll from time to time. I guess it is time to re-Poll. I added 2 more choices (LinkedIn allows maximum 5 choices in their polls and it is clear not enough for this poll), based on a feedback I got: Omniscope and Visual Insight/Microstrategy. I also got some angry voters complaining that certain vendors are funding this poll. This is completely FALSE, I am unaffiliated with any of vendors, mentioned in this poll and I am working for completely independent (from those vendors) software company, see the About page of this Blog.
Microsoft finally released SQL Server 11 "Denali" as CTP3 (Community Technology Preview) for public ... Preview. Microsoft is (these are politeness words I can type) stubbornly refusing to have/build own Data Visualization Product. I doubt Crescent "experience" can be considered as a product, especially because it is Silverlight-base, while world already moved to HTML5.
If you have 7 minutes, you can watch Crescent Demo from WPC11, which is showing that while trailing a few years behind DV Leaders and Google, Microsoft is giving to its die hard followers something to cheer about:
I have to admit, that while there is nothing new (for DV expert) in video above, it is a huge progress compare with Excel-based Data Visualizations, which Microsoft tried to promote as a replacement of ProClarity and PerformancePoint Server. Even Microsoft itself positions Crescent (which is 32-bit only!) as a replacement for SSRS Report Builder, so DV Leaders can sleep well another night.
However, Microsoft's BI Stack is the number 4 or 5 on my list of DV Leaders and CTP3 is so rich with new cool functionality, that it deserves to be covered on this blog.
Of course major news is availability of Tabular Data Model, which means VertiPaq in-memory columnar Engine, similar to PowerPivot Engine but running on Server without any SharePoint (which is a slow virus, as far as I am concerned) and without stupid SharePoint UI and limitations and I quote Microsoft: " In contrast with the previous release, where VertiPaq was only available via in PowerPivot for SharePoint, you can now use VertiPaq on a standalone Analysis Services instance with no dependency on SharePoint."!
SSAS (SQL Server Analysis Services) has new (they may existed before, but before CTP3 - ALL who knew that were under NDA) features like memory paging (allows models to be larger than the physical memory of the server, means unlimited scalability and BIG Data support), row level security (user identity used to hide/show visible data), KPI, Partitions; CTP3 removes the maximum 4GB file size limit for string storage file, removes the limit of 2 billion rows per table (each column is still limited to a maximum of 2 billion distinct values, but in columnar database it is much more tolerable restriction!).
New version of PowerPivot is released with support of Tabular Model and I quote: "You can use this version of the add-in to author and publish PowerPivot workbooks from Excel 2010 to Microsoft SQL Server" and it means no SharePoint involvement again! As Marco Russo put it: "Import your existing PowerPivot workbooks in a Tabular project (yes, you can!)" and I agreed 100% with Marco when he said 4 times: Learn DAX!
After 3 years of delays, Microsoft is finally has BIDS for Visual Studio 2010 and that is huge too, I quote again: "The Tabular Model Designer ... is now integrated with Microsoft SQL Server “Denali” (CTP 3) Business Intelligence Development Studio." It means that BIDS now is not just available but is the main unified development interface for both Multidimensional and Tabular Data Models. Now we can forget about Visual Studio 2008 and finally use more modern VS2010!
Another extremely important for Data Visualization feature is not in SSAS but in SQL Server itself: Columnstore index is finally released and I a quote 1 more time again: "The ... SQL Server (CTP 3) introduces a new data warehouse query acceleration feature based on a new type of index called the columnstore. This new index ... improves DW query performance by hundreds to thousands of times in some cases, and can routinely give a tenfold speedup for a broad range of decision support queries... columnstore indexes limit or eliminate the need to rely on pre-built aggregates, including user-defined summary tables, and indexed (materialized) views. Furthermore, columnstore indexes can greatly improve ROLAP performance" (ROLAP can be used for real-time Cubes and real-time Data Visualizations).
All these cool SQL Server 11 new stuff is coming soon into Azure Cloud and this can be scary for any DV vendor, unless it knows (Tableau does; Qliktech and Spotfire still ignore SSAS) how to be friendly with Microsoft.
As we know now the newly coined by Microsoft term BISM (Business Intelligence Semantic Model) was a marketing attempt to have a "unified" umbrella
for 2 different Data Models and Data Engines: Multidimensional Cubes (invented by Mosha Pasumansky 15 years ago and the foundation for SSAS and MDX - SQL Server Analysis Services) and Tabular Model (used in PowerPivot and VertiPaq in-memory columnar Database with new DAX Language which is going to be very important for future Data Visualization projects).
New CTP3-released BIDS 2010 (finally almighty Visual Studio 2010 will have a "Business Intelligence Development Studio" after 3+ years of unjustified delays!) UI-wise will able to handle these 2 Data Models, but it is giving me a clue why Mosha left Microsoft for Google. And lack of DV product is a clue for me why Donald Farmer (face of Microsoft BI) left Microsoft for Qliktech.
Even more: if you need both Data Models to be present, you need to install 2 (TWO!) different instances of "Analysis Services": one with Multidimensional Engine and one with new Tabular (VertiPaq/PowerPivot) Engine. It seems to me not as ONE "BI" architecture but TWO "BI" Architectures, interface-glued on Surface by BIDS 2010 and on back-end by all kind of Data Connectors. Basically Microsoft is in confused BI state now because financially it can afford 2 BI Architectures and NO Data Visualization Product!
I cannot believe I am saying this, but I wish Bill Gates back from retirement (it will be good for Microsoft shares and good for Microsoft market capitalization too - just ask Apple's shareholders about Steve and they will say he is a god)!
As I said many times, BI is just a marketing umbrella for multiple products and technologies and Data Visualization became recently as one of the most important among those. Data Visualization (DV) so far is a very focused technology and article below shows how to publish Excel Data Visualizations and Dashboards on Web. Actually a few Vendors providing tools to publish Excel-based Dashboards on Web, including Microsoft, Google, Zoho, Pagos and 4+ other vendors:
I leave to the reader to decide if other vendors can compete in business of publishing Excel-based Dashbaords on Web, but the author of the artcile below provides a very good 3 criterias of how to select the vendor, tool and technology for it (and when I used it myself it left me only with 2 choices - the same as described in article).
Author: Ugur Kadakal, Ph.D., CEO and founder of Pagos, Inc.
In previous article (see "Excel as BI Platform" here) I discussed Excel’s use as a Business Intelligence platform and why it is exceedingly popular software among business users. In 2nd article ("Dos&Don’ts of Building Successful Dashboards in Excel") I talked about some of the principles to follow when building a dashboard or a report in Excel. Together this is a discussion of why Excel is the most powerful self-service BI platform.
However, one of the most important facets of any BI platform is web enablement and collaboration. It is important for business users to be able to create their own dashboards but it is equally important for them to be able to distribute those dashboards securely over the web. In this article, I will discuss two technologies that enable business users to publish and distribute their Excel based dashboards over the web.
Selection Criteria
The following criteria were selected in order to compare the products:
Ability to convert a workbook with most Excel-supported features into a web based application with little to no programming.
Dashboard management, security and access control capabilities that can be handled by business users.
On-premise, server-based deployment options.
Criteria #3 eliminates online spreadsheet products such as Google Docs or Zoho. As much as I support cloud based technologies, in order for a BI product to be successful it should have on-premise deployment options. Without on-premise you neglect the possibility of integration with other data sources within an organization.
There are other web based Excel conversion products on the market but none of them meet the criteria of supporting most Excel features relevant to BI; therefore, they were not included in this article about how to publish Excel Dashboard on Web .
Below is a Part 2 of the Guest Post by my guest blogger Dr. Kadakal, (CEO of Pagos, Inc.). This article is about of how to build Dashboards and Data Visualizations with Excel. The topic is large, and the first portion of article (published on this blog last week) contains the the general Introduction and the Part 1 “Use of Excel as a BI Platform Today“.
The Part 2 – “Dos and Don’ts of building dashboards in Excel“ is below and Part 3 – “Publishing Excel dashboards to the Internet“ is coming soon. It is easy to fall into a trap with Excel, but if you avoid those risks as described in article below, Excel can become of one of the valuable BI and Data Visualization (DV) tool for user. Dr. Kadakal said to me recently: "if the user doesn't know what he is doing he may end up spending lots of time maintaining the file or create unnecessary calculation errors". So we (Dr. Kadakal and me) hope that article below can save time for visitors of this blog.
BI in my mind is a marketing umbrella for multiple products and technologies, including RDBMS, Data Collection, ETL, DW, Reporting, Multidimensional Cubes, OLAP, Columnar and in-Memory Databases, Predictive and Visual Analytics, Modeling and DV.
Data Visualization (aka DV), on other hand, is a technology, which enabling people to explore, drill-down, visually analyze their data and visually search for data patterns, like trends, clusters, outliers, etc. So BI is marketing super-abused term, while DV so far is focused technology and article below shows how to use Excel as a great Dashboard builder and Data Visualization tool.
Dos&Don’ts of Building Successful Dashboards in Excel
In previous week's post (see also article "Excel as BI Platform" here) I discussed Excel’s use as a Business Intelligence platform and why it is exceedingly popular software among business users. In this article I will talk about some of the principles to follow when building a dashboard or a report in Excel.
One of the greatest advantages of Excel is its flexibility: it puts little or no constraints on the user’s ability to create their ideal dashboard environments. As a result, Excel is being used as a platform for solving practically any business challenge. You will find individuals using Excel to solve a number of business-specific challenges in practically any organization or industry. This makes Excel the ultimate business software.
On the other hand, this same flexibility can lead to errors and long term maintenance issues if not handled properly. There are no constraints on data separation, business logic or the creation of a user interface. Inexperienced users tend to build their Excel files by mixing them up. When these facets of a spreadsheet are not properly separated, it becomes much harder to maintain those workbooks and they become prone to errors.
In this article, I will discuss how you can build successful dashboards and reports by separating data, calculations and the user interface. The rest of this post you can find in this article
It discusses how to prepare Data (both static and external) for dashboards, how to build formulas and calculation models, UI and Input Controls for Dashboards and of course - Pivots,Charts, Sparklines and Conditional Formatting for innovative and powerful Data Visualizations in Excel.
This is a Part 1 of surprise Guest post. My guest is Ugur Kadakal, Ph.D., he is the CEO and founder of Pagos, Inc., which he started almost 10 years ago.
Dr. Kadakal is an expert in Excel, Business Intelligence, Data Analytics and Data Visualization. His comprehensive knowledge of Excel, along with his ambitious inventions and ideas, supply the foundation for all Pagos products, which include SpreadsheetWEB (which converts Excel spreadsheets into web applications), SpreasheetLIVE (a fully-featured, browser-based spreadsheet application environment) and Pagos Spreadsheet Component (which integrates Excel spreadsheets into enterprise web applications).
Pagos started and hosted the largest free collection and repository of professional templates of Excel spreadsheets on the web: http://spreadsheetzone.com . 3 Excel-based Dashboard below can be found on this very popular repository and done by Dr. Kadakal:
The topic is large, so this Guest article is splitted on 3 blog posts. The first portion of article contains the Introduction and Part 1 "Use of Excel as a BI Platform Today", then I expect Dr. Kadakal will do at least 2 more posts: Part 2 - "Dos and Don’ts of building dashboards in Excel", Part 3 - "Moving Excel dashboards to the Web".
Excel as a Business Intelligence Platform – Part 1
Introduction
Electronic spreadsheets were one of the very first Business Intelligence (BI) software. While the availability of spreadsheet software and it use as a tool for data analysis dates back to the 1960s, its application in the BI field began with the integration of OLAP and pivot tables. In 1991, Lotus released Improve, followed by Microsoft’s release of PivotTable in 1993. However, Essbase was the first scalable OLAP software to handle large data sets that the early spreadsheet software was incapable of. This is where its name comes from: Extended Spread Sheet Database.
There is no doubt that Microsoft Excel is the most commonly used software for BI purposes. While Excel is general business software, its flexibility and ease of use makes it popular for data analysis with millions of users worldwide. Excel has an install base of hundreds of millions of desktops: far more than any other BI platform. It has become a household name. From educational utilization to domestic applications and enterprise implementation, Excel has been proven incredibly indispensable. Most people with commercial or corporate backgrounds have developed a proficient Excel skillset. This makes Excel the ultimate self-service BI platform. However, like all systems, Excel has some weaknesses that make it difficult to use as a BI tool under certain conditions.
Use of Excel as a BI Platform Today
Small Businesses
Traditionally, small businesses are not considered as an important market segment by most BI vendors. Their data analysis and reporting needs are limited primarily due to their smaller commercial volumes. However, this is changing quickly as smaller organizations begin to collect large amounts of data, thanks to the Internet and social media, and require tools to manage that data. However, what is not changing is the limited financial resources available to them. Small businesses cannot spare to spend large amounts of money on BI software or consultants to aid them in the creation of the applications. That’s why Excel is the ideal platform for them and will most probably remain that way for a foreseeable future. The reasons are clear: (1) most of them already have Excel licenses, (2) most of their users know how to use Excel and (3) their needs are simpler and can be met with Excel.
Mid-Range Businesses
Mid-range businesses are a quickly growing market segment for BI vendors. Traditionally, Excel as a BI platform has been more popular among these businesses. Cost and availability are the primary factors in this. However, two aspects have been steering them to searching for alternatives: (1) Excel can no longer handle their growing data volumes and (2) other BI vendors started offering cost-effective alternatives.
As a result, Excel’s market share in this field is in decline although it still remains the most popular. On the other hand, with the release of Office 2010 and its extended capabilities for handling very large data sets, Excel stands a good chance at reversing this decline.
Large Enterprises
The situation with large enterprises is rather complex. Most of them already have large-scale a BI implementation in place. Those implementations often connect various databases and data warehouses within the organizations. They have made significant investments and continue doing so to expand and maintain their BI systems. They already have a number of dashboards and reports designed to serve their business units. However, business users always need new and different dashboards and reporting tools. The only software that gives them the ultimate flexibility in creating their own reports is Excel. As a result, even in large Enterprises, usage of Excel for BI purposes is common. Business users often go to their data warehouses or BI tools and get a data extract to bring into Excel. They can then prepare their analysis and build their reports in Excel.
Enterprises will continue using their existing platforms because they have made huge investments building those systems. However, Excel use by business users as their secondary BI and reporting tool will continue to rise unless the alternative vendors significantly improve their self-servicing capabilities.
Summary
Excel is one of the ultimate business platforms and offers unparalleled features and capabilities to non-programmers. This makes it an ideal self-service BI platform. In this article, we examined the use of Excel as a BI platform in companies of different sizes. In the next article of this series, we will discuss how to use Excel more efficiently as a BI platform, from handling data to calculations and visual interactions.
Comparison of DV Tools is the most popular page (and post) of this site, visited by many thousands of people. Some of them keep asking to append this comparison with different additional features, one of them is a comparison of requirements of leading DV tools for file and memory footprint and also for reading and saving time.
I took mid-sized dataset (428999 rows and 135 columns), exported it into CSV and compressed it to ZIP format, because all native DV formats (QVW by Qlikview, DXP by Spotfire, TWBX by Tableau and XLSX by Excel and PowerPivot) are compressed one way or another. My starting filesize (of ZIPped dataset) was 56 MB. Here is what I got, see for yourself:
One comment is that numbers above are all relative to configuration of hardware used for tests and also depend on other software I ran during tests, because that software also requires RAM, CPU cycles, disk I/O and even on speed of repainting applications windows on screen, especially for Excel. I probably will add more comments to this post/page, but my first impression from this comparison is that new Tableau's Data Engine (released in version 6.0 and soon will be updated in 6.1) made Tableau more competitive. Please keep in mind, that comparison of in-memory footprint was much less significant in above test, because Qlikview, Excel and PowerPivot putting all dataset into RAM, while Tableau and Spotfire can leave some (unneeded for visualization) data on disk, treating it as "virtual memory". Also Tableau using 2 executables (not just one EXE as others): tableau.exe (or tabreader.exe) and tdserver64.exe
Since Tableau is the only DV Leading software, capable to read from SSAS Cubes and from PowerPivot (local SSAS) Cubes, I also took large SSAS Cube and for testing purposes I selected SSAS Sub-Cube with 3 Dimensions, 2 Measures and 156439 "rows", measured the Time and Footprint, needed for Tableau to read Sub-Cube, Refresh it in Memory, Save to local application file, and also measurted "Cubical" Footprint of it in Memory and on Disk and then compared all results with the same tests while running Excel 2010 alone and Excel 2010 with PowerPivot:
While Tableau's ability to read and visualize Cubes is cool, performance-wise Tableau is far behind of Excel and PowerPivot, especially in Reading department and memory footprint. In Saving department and File footprint Tableau is doing nothing because it is not saving cube locally in its local application TWBX file (and it keeps data in SSAS cube outside of Tableau) so Tableau's file footprint for SSAS Cubes is not an indicator but for PowerPivot-based local Cubes Tableau does better job (saving data into local application file) then both Excel and PowerPivot!
TIBCO released Spotfire 3.3 and first (see what is new here) that jumped to my eyes was how mature this product is. For example, among new features is improved scalability - each additional simultaneous user of a web analysis initially claims very little additional system memory:
Many Spotfire customers will be able to support a greater number of web users on their existing hardware by upgrading to 3.3. Spotfire Web Player 3.3 includes significant improvements in memory consumption (as shown above for certain scenarios). Theoretically goal is to minimize the amount of system memory needed to support larger numbers of simultaneous users on the same analysis file. Main use case here: the larger the file and the greater the number of simultaneous web users on that file, then less initial system memory required to support each additional user: it is greatly reduced compared to version 3.2.1 and earlier.
Spotfire 3.3 also includes collaborative bookmarking, which enables all Spotfire users to capture a dashboard - its complete configuration, including markings, drop down selections, and filter settings and share that visualization immediately with other users of that same dashboard, regardless of client in use. Spotfire actually not just a piece of Data Visualization Software, but a real Analytical Platform with large portfolio of products, including completely integrated S-PLUS (commercial version of R Library which has million of users), best Web Client (you can go Zero-footprint with Spotfire Web Player or/and partially free Spotfire Silver), free iPad Client version 1.1.1 (requires iTunes, so be prepared for Apple intrusion), very rich API, SDK, integration with Visual Studio, support of IronPython and JavaScript , well-thought Web Architecture, set of Extension Points etc.
My only and large concern with Spotfire is its focus, since it is part of a large corporation TIBCO, which has 50+ products and 50+ reasons to focus on something else. Indirectly it can be confirmed with sales: my estimate that Tableau is growing much faster than Spotfire (sales-wise) and Qlikview Sales probably 3 times larger (dollar-wise) than Spotfire sales. Since TIBCO bought Spotfire in 2007, I expected Spotfire will be integrated with other great TIBCO products, but after 4 years it is still not a case... And TIBCO has no reason to change its corporate policies, since its busines is good and stock is doing well: