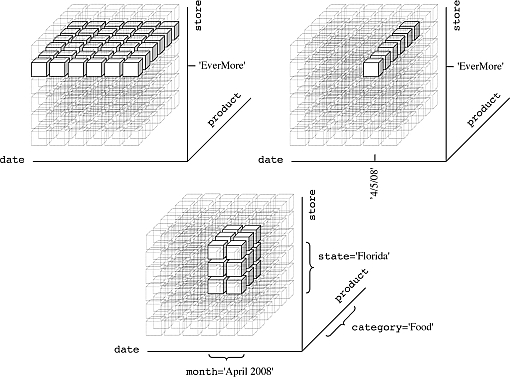
OLAP (online analytical processing) cube on one hand extends a 2-dimensional array (spreadsheet table or array of facts/measures and keys/pointers to dictionaries) to a multidimensional DataCube, and on other hand DataCube is using datawarehouse schemas like Star Schema or Snowflake Schema.

The OLAP cube consists of facts, also called measures, categorized by dimensions (it can be much more than 3 Dimensions; dimensions referred from Fact Table by "foreign keys"). Measures are derived from the records in the Fact Table and Dimensions are derived from the dimension tables, where each column represents one attribute (also called dictionary; dimension can have many attributes). Such multidimensional DataCube organization is close to a Columnar DB data structures. One of the most popular usage of datacubes is a visualization of them in form of Pivot tables, where attributes used as rows, columns and filters while values in cells are appropriate aggregates (SUM, AVG, MAX, MIN, etc.) of measures.
OLAP operations are foundation for most UI and functionality used by Data Visualization tools. The DV user (sometimes called analyst) navigates through the DataCube and its DataViews for a particular subset of the data, changing the data's orientations and defining analytical calculations. The user-initiated process of navigating by calling for page displays interactively, through the specification of slices via rotations and drill down/up is sometimes called "slice and dice". Common operations include slice and dice, drill down, roll up, and pivot:
Slice:
A slice is a subset of a multi-dimensional array corresponding to a single value for one or more members of the dimensions not in the subset.

Dice:
The dice operation is a slice on more than two dimensions of a data cube (or more than two consecutive slices).
 Drill Down/Up:
Drilling down or up is a specific analytical technique whereby the user navigates among levels of data ranging from the most summarized (up) to the most detailed (down).

Roll-up:
(Aggregate, Consolidate) A roll-up involves computing all of the data relationships for one or more dimensions. To do this, a computational relationship or formula might be defined.
 Pivot:
This operation is also called rotate operation. It rotates the data in order to provide an alternative presentation of data - the report or page display takes a different dimensional orientation.

OLAP Servers with most marketshare are: SSAS (Microsoft SQL Server Analytical Services), Intelligence Server (Microstrategy), Essbase (Oracle also has so called Oracle Database OLAP Option), SAS OLAP Server, NetWeaver Business Warehouse (SAP BW), TM1 (IBM Cognos), Jedox-Palo (I cannot recommend it) etc.
Microsoft had (and still has) the best IDE to create OLAP Cubes (it is a slightly redressed version of Visual Studio 2008, known as BIDS - Business Intelligence Development Studio usually delivered as part of SQL Server 2008) but Microsoft failed (for more than 2 years) to update it for Visual Studio 2010 (update is coming together with SQL Server 2012). So people forced to keep using BIDS 2008 or use some tricks with Visual Studio 2010.
Permalink: http://apandre.wordpress.com/2010/06/13/data-visualization-and-cubes/

Hi: Any reference about Jedox-Palo?
ReplyDeleteThanks
Great explanation!
ReplyDelete